Categories
Economic Indicators Latest Updates News

National Unemployment Lowest in 10 Years, Employment up Slightly

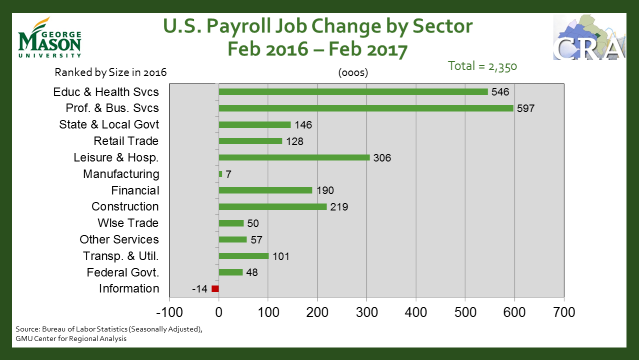
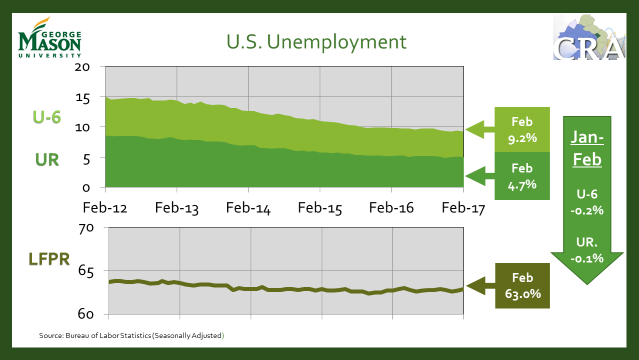
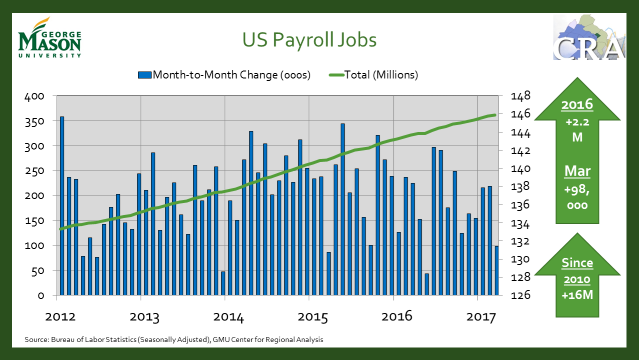
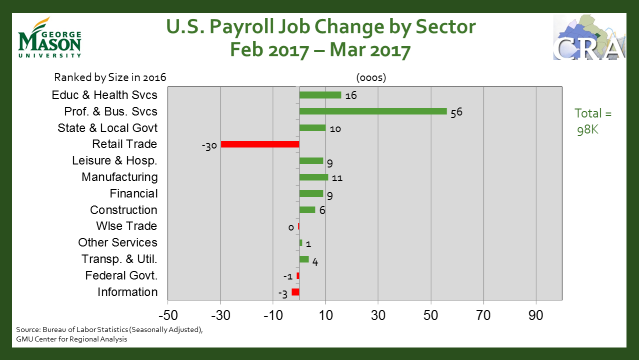
National employment situation numbers released this morning show payroll employment increasing by only 98,000 and the unemployment rate decreasing 0.2 percentage points to 4.5 percent. The professional and business services sector saw the largest growth at an additional 56,000 jobs and for the second straight month, retail trade lost nearly 30,000. Total employment is up 2.18 million from March 2016. 

The relatively small jobs growth could be due to large February jobs numbers, boosted by unseasonably good weather across the country, as well as the late snow storm in the upper midwest and northeast in March that possibly suppressed some seasonal hiring. Other measures of the economy remain strong, so a slowdown of one month is no cause for concern.

The unemployment rate is now at its lowest point since May 2007 as the economy gets closer to full employment. The better news lies in the U-6 unemployment rate decreasing 0.3 percentage points to 8.9 percent (includes marginally attached workers and those employed part-time for economic reasons). As the gap shrinks between the unemployment rate (U-3) and the U-6 rate we see the number of underemployed and discouraged workers decrease.

Categories
Economic Indicators Latest Updates News

Washington Area Job Growth Remains Stable

New metropolitan area employment and unemployment numbers released today show continued job growth for the Washington region with  18,300 jobs added in February. This is an increase of 62,400 jobs over February 2016, with the sectors of Professional & Business Services and Leisure & Hospitality leading the pack. The unemployment rate remains constant at 3.9 percent, below the nation rate of 4.7.

Between February 2016 and February 2017, Suburban Maryland saw its largest job growth since 2000, adding 31,900 jobs. February annualized employment change in the District and Northern Virginia remains similar to recent months. The unemployment rate in DC ticks slightly higher to 6.1 percent and remains the highest in the region. Northern Virginia unemployment moved down to 3.3 percent, while Suburban Maryland and the region as a whole remain steady at 3.9 percent.

Of notable concern due to the current policy environment, federal government jobs in the region remain steady but are trending downward. We will continue to monitor these numbers closely. March national employment numbers are scheduled to be released this Friday (April 7th) and regional employment numbers for March on May 3rd.

For our complete set of indicators click here

Categories
Economic Indicators Latest Updates News

2016 Population Estimates Released

The US Census Bureau released the 2016 Population County and Metro/Micro Area Population Estimates. Between 2015 and 2016, the Washington-Arlington-Alexandria, DC-VA-MD-WV Metropolitan Statistical Area (Henceforth, the Washington Metro Area), increased its population by 53,508 between July 1, 2015 and July 1, 2016.[1] This represents an increase of 0.9 percent, and continues the trend of slowing regional population growth; the region grew 1.1 percent between 2013 and 2014, and 1.0 percent between 2014 and 2015.
Figure 1 shows that the region declined in each of the three components of population change. The region had less natural increase and less international migration between 2015 and 2016, than it did between 2014 and 2015. Perhaps most noteworthy for the region is the continued growth in net domestic outmigration for the third consecutive year. Over 31,000 more domestic migrants left the Washington Metro Area than moved to the area.

Figure 1: Components of population growth in the Washington Metro Area

Several different trends emerged among the metro area’s sub-regions (DC, Maryland Suburbs, Northern Virginia). These trends (shown in Figure 2) include:

  • The Washington Metro Area’s Maryland Suburbs (Calvert, Charles, Frederick, Montgomery, and Prince George’s counties) were the slowest growing sub-region. Combined, these five counties grew 0.6 percent between 2015 and 2016 and their population grew by 14,300 people.
    • Growth in Charles, Calvert and Frederick counties occurred at a quicker rate between 2015 and 2016, than it did between 2014 and 2015.
    • Growth in Prince George’s County slowed from 0.6 percent between 2014 and 2015 when the county added 5,356 net new residents, to 0.2 percent between 2015 and 2016 when it added only 2,046.
  • The District of Columbia added 10,793 net new residents and grew 1.6 percent between 2015 and 2016.
    • The District had positive growth for all three components of population growth.
    • DC was the only sub-region with net positive domestic in-migration, as it had 2,276 net new domestic in-migrants. While still positive, this is approximately 600 fewer new in-migrants than there was between 2014 and 2015.
  • Northern Virginia grew at approximately the same rate (1.0 percent) as the overall metro area (0.9 percent), and added 28,243 net new residents between 2015 and 2016.
    • This growth was consistent with the previous year.
    • Much like the broader Washington metro area, population growth in Northern Virginia was the result of natural increase and net international migration.
      • Northern Virginia has experienced net domestic out-migration since 2013, thereby mirroring the trend in the broader region.
    • The fastest annual growth between 2015 and 2016 occurred in Loudoun County (3.0 percent), Fairfax City (1.9 percent), Stafford County (1.8 percent), Alexandria (1.7 percent), and Culpeper County (1.4 percent).
    • The greatest net population increases occurred Loudoun County (+11,386), Prince William (+5,031), Alexandria (+2,638), Stafford County (+2,569), and Arlington (+2,153).
      • Although its population is only a third of the size of Fairfax County, Loudoun County added almost 10 times more net new residents (+11,386) than Fairfax County (+1,180) did between 2015 and 2016.

Figure 2: Population change within the Washington Metro Area

The Washington metro area remains the nation’s 6th largest MSA. Its 0.9 percent population growth between 2015 and 2016 was faster than the national population growth rate of 0.7 percent. Among the nation’s 15 largest metro areas, the Washington metro area had the 7th fastest growth rate between 2015 and 2016 (see Figure 3). It trailed Sunbelt cities such as Phoenix, Dallas, Houston, Atlanta and Miami, as well as Seattle. Regardless, the Washington metro area grew at a faster rate between 2015 and 2016 than did many other large Northeastern (e.g., New York, Boston, Philadelphia) and Midwestern cities (e.g., Chicago, Detroit).

Figure 3: Population change in large metro areas (2015-2016)

Categories
Economic Indicators Latest Updates News

Trump Budget Could Undercut Metro Ridership Recovery

From WAMU

President Donald Trump’s initial budget proposal does not explicitly attack funding for the D.C. region’s transit agency, but if the plan’s aim of shrinking the federal workforce is realized, Metro could be damaged at a time when it needs every possible rider.

Metro’s average weekday ridership is at its lowest level since 2003. System leaders are anticipating that some commuters will return in the summer after the disruptive SafeTrack rebuilding program ends and reliability improves, but a ridership recovery could be undercut if the Republican-led Congress goes along with the president’s proposal to dismantle parts of the federal bureaucracy.

“If you were to look at some of the more dramatic elements of the Trump proposal, we’re talking in terms of what might be that 20,000 to 25,000 federal jobs that would disappear,” said economist Terry Clower, director of the Center for Regional Analysis at George Mason University. A loss of that magnitude would cost Metro several thousand trips per day.

Read more here

Categories
Economic Indicators Latest Updates News

February US Employment Growth Holds Steady

February National employment numbers were released this morning, providing the first picture of employment numbers under the Trump presidency. The US economy added 235,000 jobs and unemployment remained relatively unchanged at 4.7%, down from 4.8% in January. All sectors grew from February of last year except the information sector, which has seen consistent decline in the past year. Both labor force participation rate and the U-6 unemployment rate have remained steady at 63% and 9.2% respectively.

January employment numbers for the Washington Region MSA will be released in one week on Friday, March 17th. Expect an update from CRA on the region’s economy at that time.

Categories
CRA Research Economic Indicators Latest Updates Presentations

Assessing Alexandria and Arlington’s Regional Labor Market

On March 6, 2017, Dr. Mark C. White of George Mason University’s Center for Regional Analysis presented an overview of his most recent report, “Assessing Alexandria/Arlington’s Regional Labor Market”. This report will help the Alexandria/Arlington Regional Workforce Council’s stakeholders to better understand trends shaping the region’s workforce and identify sources of current and future labor demand. A copy of Dr. White’s presentation and report can be found here:

Presentation

Full Report

Categories
Economic Indicators Latest Updates

Federal Workforce Concentration

Federal workers are vital to the DC region’s economy. Concerns are rising regarding the impending potential draw-down in the federal workforce. More to come regarding the characteristics of those employed by the federal government in our region.

Note: These numbers include both civilian and military federal employees. This, in combination with a smaller overall workforce likely explains higher concentrations in counties to the south.