
The Washington DC Metropolitan Area Continues to Show Lackluster Economic Growth
The US Bureau of Economic Analysis released data on 2016 Gross Domestic Product by Metropolitan Area. In 2016, the Washington-Arlington-Alexandria, DC-VA-MD-WV Metropolitan Statistical Area (Hence forth, the Washington Metro Area) had a $449.3 billion economy. This represents an increase of 1.1 percent over the revised 2015 figure of $444.4 billion.[1] Between 2015 and 2016, the Washington Metro Area GDP grew slower than the national rate of 1.5 percent but faster than the Commonwealth of Virginia which grew 0.6 percent.
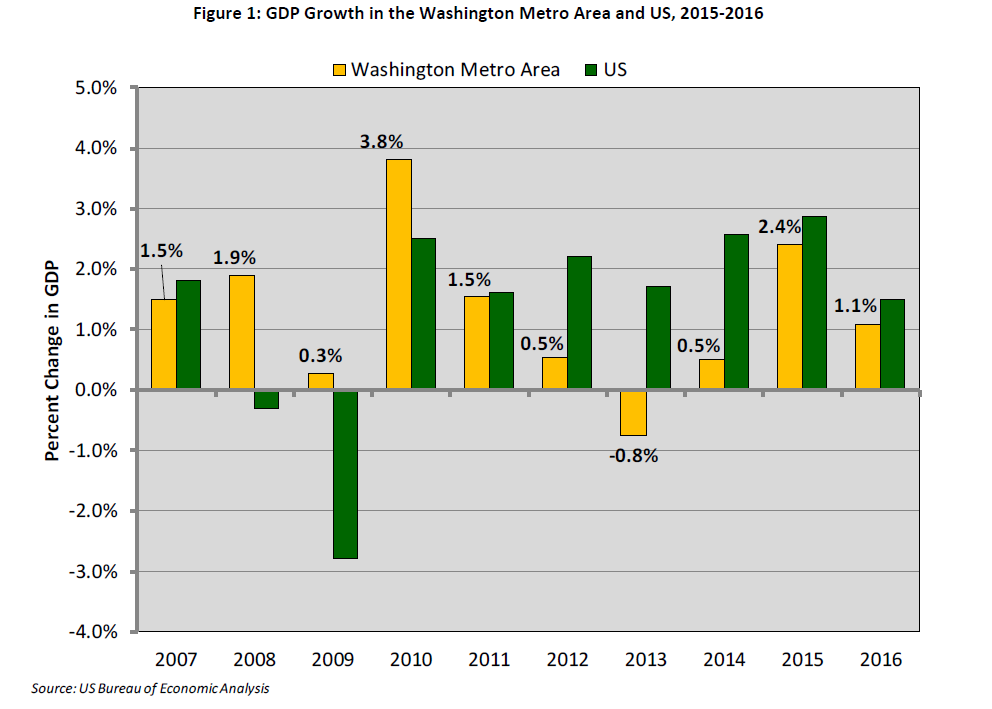
This is the third consecutive year of regional economic growth. The GDP increase was led by growth in the Professional and Business Services sector – contributing 0.55 percentage points of the 1.1 percent increase in Washington Metro Area GDP. The finance, insurance, real estate, rental, and leasing sector had declining contributions to area GDP – reducing growth in area GDP by 0.15 percentage points.
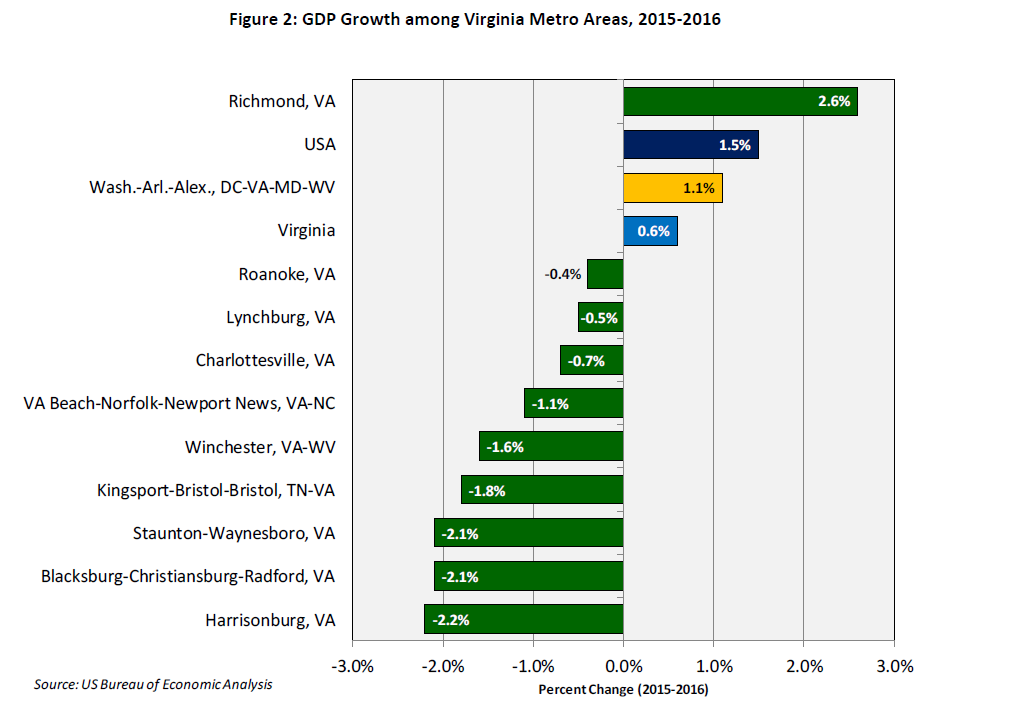
Figure 2 shows that among the ten Metro Areas in Virginia, the Washington Metro Area is one of two that showed growth in GDP between 2015 and 2016. Richmond experienced the largest GDP growth at 2.6 percent, and was the only Virginia metro area to have consistently positive economic growth over the past five years. The metros along the I-81 Corridor, Staunton-Waynesboro, Blacksburg-Christiansburg-Radford, and Harrisonburg, saw the largest declines in GDP at -2.1 percent, -2.1 percent, and -2.2 percent respectively between 2015 and 2016. All three metros had positive economic growth of nearly 3 percent between 2014 and 2015.
[1] The 2015 Washington Metro Area GDP was upwardly revised from 442.4 billion, moving from 1.3 percent growth between 2014-2015 to 2.4 percent growth over the same period in the revised estimate.