Recently the financial press has had several stories talking about interest rate spreads and inverted yield curves with whispers of the word “recession”. But what exactly is an inverted yield curve and what predictive role does it play in the U.S. economy?
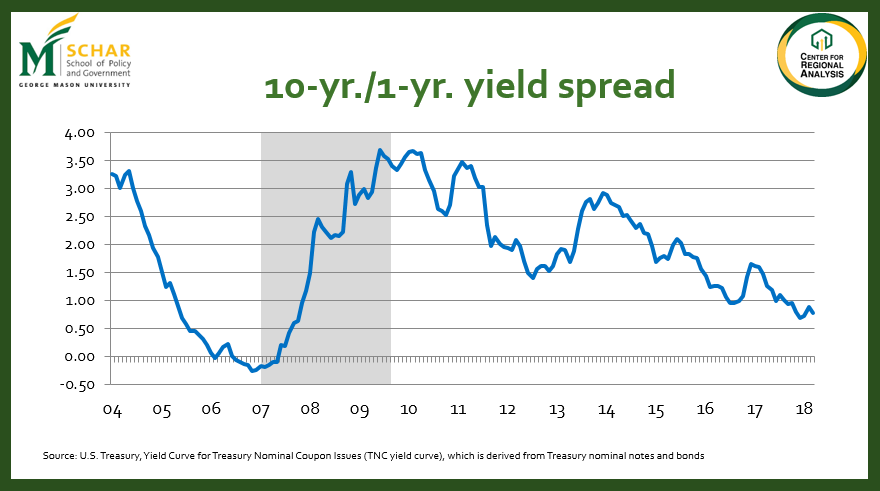
The yield curve is the difference in short-term rates like a three-month or 1-year Treasury note and long-term interest rates like on 10 year Treasury bonds. Short-term interest rates paid on Treasury notes are usually lower than interest paid on long-term bonds. If short-term rates are higher than long-term rates, the yield curve is upside down, or inverted. Over the past several months, the difference in the short term and long term rates have become very small, and there is concern the yield curve will invert (see chart below).
There are many factors that affect government bond rates including stock prices (an alternative investment to bonds), currency exchange rates (international investors), policy actions by the Federal Reserve Bank and other central banks in Europe, China and elsewhere, government deficits/debt levels, and other factors. For this discussion, we will focus on perceptions of risk and uncertainty about future U.S. economic performance. When investors view the outlook for the US economy as uncertain (higher levels of risk), they will expect to earn higher interest rates on government notes and bonds. From this perspective, when short-term rates are higher than long-term rates, investors are saying they are less certain about the economy next year versus ten years from now. That’s extraordinary. Imagine trying to make business decisions in the next 12 months versus 10 years from now and being less certain about next year than far into the future.
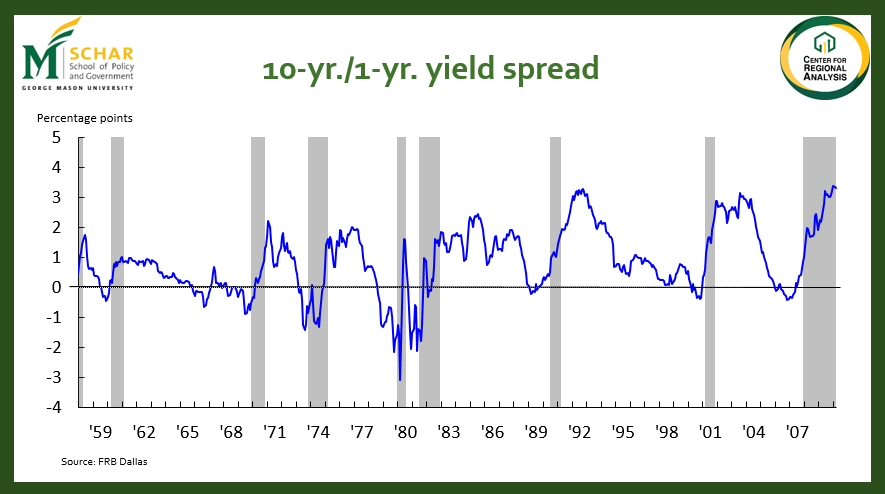
Since 1959 the yield curve has inverted 8 times. For 7 of those times the US economy went into recession within a few months. The figure below shows the spread between 10-year Treasury Bonds and 1-year Treasury Notes. The grey bands indicate recessions in the U.S. economy. Some financial experts see an inverted yield curve as almost a sure sign of an impending recession.
So, are we headed to a recession? After all, even though economic growth since the end of the Great Recession has been relatively slow, the current growth cycle is long-in-the-tooth. In historic terms, we are overdue for a recession. Fortunately, we see the very small yield spread as an artifact of other market factors. Short-term interest rates are increasing in large part because the Federal Reserve Bank is raising its rates to more market-normal levels. On the other end, the economy is doing better and more money is flowing into pension funds, foundations, and other institutional investors. These institutional investors are buying more long-term bonds, which means that interest rates paid on these financial instruments is being held down, which narrows the spread. Still, if we do experience an inverted yield curve over the next several months, expect some market players to “freak out,” at least temporarily.
Many realtor clients in Northern Virginia are highly attuned to market data such as interest rate spreads. If your clients show signs of “freaking out,” we suggest telling them to consult their financial advisors and to consider that the fundamentals of the U.S. economy are still strong. With interest rates still low and a very solid job market, this remains an excellent time to be in the housing market.