The US Census Bureau released the 2016 Population County and Metro/Micro Area Population Estimates. Between 2015 and 2016, the Washington-Arlington-Alexandria, DC-VA-MD-WV Metropolitan Statistical Area (Henceforth, the Washington Metro Area), increased its population by 53,508 between July 1, 2015 and July 1, 2016.[1] This represents an increase of 0.9 percent, and continues the trend of slowing regional population growth; the region grew 1.1 percent between 2013 and 2014, and 1.0 percent between 2014 and 2015.
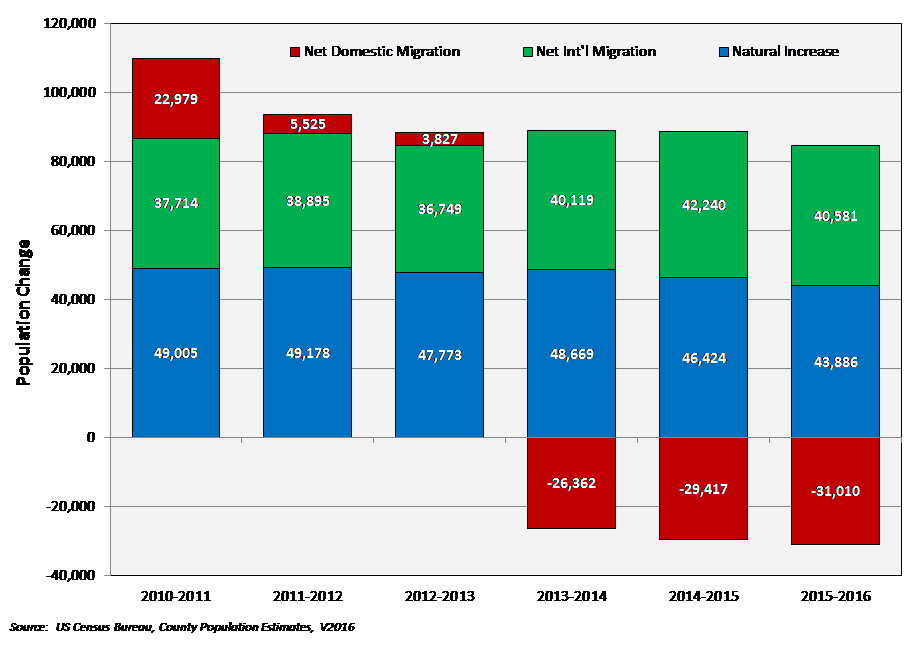
Figure 1 shows that the region declined in each of the three components of population change. The region had less natural increase and less international migration between 2015 and 2016, than it did between 2014 and 2015. Perhaps most noteworthy for the region is the continued growth in net domestic outmigration for the third consecutive year. Over 31,000 more domestic migrants left the Washington Metro Area than moved to the area.
Figure 1: Components of population growth in the Washington Metro Area
Several different trends emerged among the metro area’s sub-regions (DC, Maryland Suburbs, Northern Virginia). These trends (shown in Figure 2) include:
- The Washington Metro Area’s Maryland Suburbs (Calvert, Charles, Frederick, Montgomery, and Prince George’s counties) were the slowest growing sub-region. Combined, these five counties grew 0.6 percent between 2015 and 2016 and their population grew by 14,300 people.
- Growth in Charles, Calvert and Frederick counties occurred at a quicker rate between 2015 and 2016, than it did between 2014 and 2015.
- Growth in Prince George’s County slowed from 0.6 percent between 2014 and 2015 when the county added 5,356 net new residents, to 0.2 percent between 2015 and 2016 when it added only 2,046.
- The District of Columbia added 10,793 net new residents and grew 1.6 percent between 2015 and 2016.
- The District had positive growth for all three components of population growth.
- DC was the only sub-region with net positive domestic in-migration, as it had 2,276 net new domestic in-migrants. While still positive, this is approximately 600 fewer new in-migrants than there was between 2014 and 2015.
- Northern Virginia grew at approximately the same rate (1.0 percent) as the overall metro area (0.9 percent), and added 28,243 net new residents between 2015 and 2016.
- This growth was consistent with the previous year.
- Much like the broader Washington metro area, population growth in Northern Virginia was the result of natural increase and net international migration.
- Northern Virginia has experienced net domestic out-migration since 2013, thereby mirroring the trend in the broader region.
- The fastest annual growth between 2015 and 2016 occurred in Loudoun County (3.0 percent), Fairfax City (1.9 percent), Stafford County (1.8 percent), Alexandria (1.7 percent), and Culpeper County (1.4 percent).
- The greatest net population increases occurred Loudoun County (+11,386), Prince William (+5,031), Alexandria (+2,638), Stafford County (+2,569), and Arlington (+2,153).
- Although its population is only a third of the size of Fairfax County, Loudoun County added almost 10 times more net new residents (+11,386) than Fairfax County (+1,180) did between 2015 and 2016.
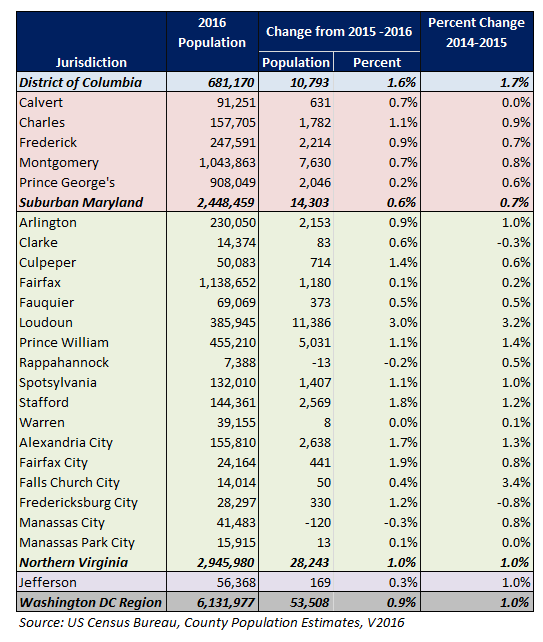
Figure 2: Population change within the Washington Metro Area
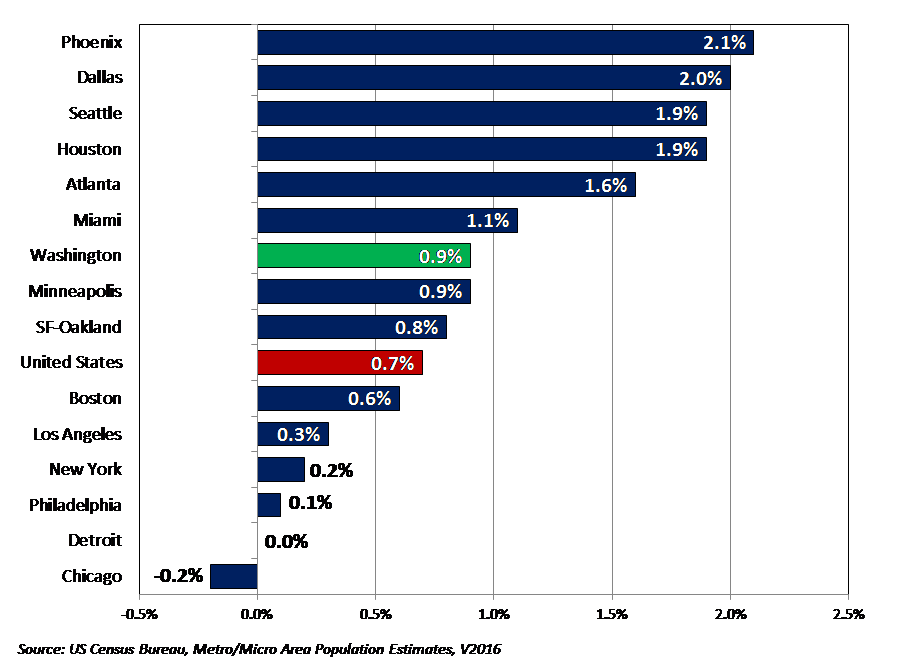
The Washington metro area remains the nation’s 6th largest MSA. Its 0.9 percent population growth between 2015 and 2016 was faster than the national population growth rate of 0.7 percent. Among the nation’s 15 largest metro areas, the Washington metro area had the 7th fastest growth rate between 2015 and 2016 (see Figure 3). It trailed Sunbelt cities such as Phoenix, Dallas, Houston, Atlanta and Miami, as well as Seattle. Regardless, the Washington metro area grew at a faster rate between 2015 and 2016 than did many other large Northeastern (e.g., New York, Boston, Philadelphia) and Midwestern cities (e.g., Chicago, Detroit).
Figure 3: Population change in large metro areas (2015-2016)