Categories
News Slider Uncategorized

SFI Economic Forum Tuesday November 15 Save the Date

Good Day!

We are excited to announce the date for this year’s Economic Forum to be presented jointly by the Stephen S. Fuller Institute and Center for Regional Analysis at Mason.

Read the Conference Issue of Washington Economy Watch: Here

Come hear GMU colleagues Stephen Fuller and Terry Clower as they examine the DC region’s current challenges, opportunities, and economic outlook for 2023.

When:

Tuesday, November 15, 2022

8:30 am – 11:00 am (ET)

Where:

GMU Arlington Campus

Van Metre Hall, 1st Floor Auditorium

3351 Fairfax Dr., Arlington, VA 22201

Metro: Clarendon, Virginia Square

Parking Garage Access: Off N. Kirkland Street

Registration

Attendance is free but please register at CRA_Event

Agenda   
8:30 – 9:00Coffee and Fellowship  
9:00 – 9:03Welcome to Campus Dean Mark Rozell
9:03 – 9:10President’s Welcome Dr. Greg Washington
9:10 – 9:20Opening remarks Bob Buchanan
9:20 – 10:00Is the Washington Region’s Economy Still Recession Proof? Dr. Stephen S. Fuller
10:00 – 10:40Challenges, Opportunities, & Adaptation: The National Capital Region in 2023 and Beyond Dr. Terry L. Clower
10:40 – 11:00Q&A, Engagement Dr. Clower & Dr. Fuller
11:00Adjourn  

Questions?  Email us at cra@gmu.edu

We look forward to seeing you all in person on November 15, 2022!

Categories
Uncategorized

Regional Economic Indicators

The Center for Regional Analysis routinely updates data that provide a greater understanding of what drives the Greater Washington regional economy.

View the current set of indicator data charts here 

CRA produces more than 60 charts and graphs summarizing trends in the national and regional economies and housing markets.  Data elements include gross domestic product, jobs, unemployment, consumer confidence, coincident and leading indices, interest rates, sales of existing and new homes, home prices, and regional economic forecasts, among many other categories. CRA develops information concerning both the overall regional economy and focused/select economic and housing data for Northern Virginia, Suburban Maryland, and the District. This set of charts is updated when new data are released.

Categories
Economic Indicators Latest Updates Uncategorized

Inverted Yield Curves and an Impending Recession

Recently the financial press has had several stories talking about interest rate spreads and inverted yield curves with whispers of the word “recession”. But what exactly is an inverted yield curve and what predictive role does it play in the U.S. economy?

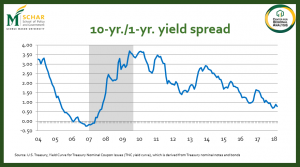
The yield curve is the difference in short-term rates like a three-month or 1-year Treasury note and long-term interest rates like on 10 year Treasury bonds. Short-term interest rates paid on Treasury notes are usually lower than interest paid on long-term bonds. If short-term rates are higher than long-term rates, the yield curve is upside down, or inverted. Over the past several months, the difference in the short term and long term rates have become very small, and there is concern the yield curve will invert (see chart below).

There are many factors that affect government bond rates including stock prices (an alternative investment to bonds), currency exchange rates (international investors), policy actions by the Federal Reserve Bank and other central banks in Europe, China and elsewhere, government deficits/debt levels, and other factors. For this discussion, we will focus on perceptions of risk and uncertainty about future U.S. economic performance. When investors view the outlook for the US economy as uncertain (higher levels of risk), they will expect to earn higher interest rates on government notes and bonds. From this perspective, when short-term rates are higher than long-term rates, investors are saying they are less certain about the economy next year versus ten years from now. That’s extraordinary. Imagine trying to make business decisions in the next 12 months versus 10 years from now and being less certain about next year than far into the future.

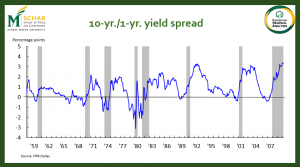
Since 1959 the yield curve has inverted 8 times. For 7 of those times the US economy went into recession within a few months. The figure below shows the spread between 10-year Treasury Bonds and 1-year Treasury Notes. The grey bands indicate recessions in the U.S. economy. Some financial experts see an inverted yield curve as almost a sure sign of an impending recession.

So, are we headed to a recession? After all, even though economic growth since the end of the Great Recession has been relatively slow, the current growth cycle is long-in-the-tooth. In historic terms, we are overdue for a recession. Fortunately, we see the very small yield spread as an artifact of other market factors. Short-term interest rates are increasing in large part because the Federal Reserve Bank is raising its rates to more market-normal levels. On the other end, the economy is doing better and more money is flowing into pension funds, foundations, and other institutional investors. These institutional investors are buying more long-term bonds, which means that interest rates paid on these financial instruments is being held down, which narrows the spread. Still, if we do experience an inverted yield curve over the next several months, expect some market players to “freak out,” at least temporarily.

Many realtor clients in Northern Virginia are highly attuned to market data such as interest rate spreads. If your clients show signs of “freaking out,” we suggest telling them to consult their financial advisors and to consider that the fundamentals of the U.S. economy are still strong. With interest rates still low and a very solid job market, this remains an excellent time to be in the housing market.

Categories
Slider Uncategorized

The Economic Impact of Local Parks

CRA has completed a study for the National Recreation and Park Association (NRPA) regarding an examination of the economic impacts of operations and capital spending by the local park and recreation agencies on the US economy.

Read the Executive Summary here

Read the Full Report here

In 2015, NRPA joined forces with the Center for Regional Analysis at George Mason University to estimate the impact of spending by local park and recreation agencies on the U.S. economy. Until then, there had been no national study to estimate the economic contribution of the thousands of local park and recreation agencies throughout the nation to the U.S. economy.

NRPA and the Center for Regional Analysis joined forces again in 2018 to update the landmark 2015 study. Both the 2015 and 2018 studies focused exclusively on the direct, indirect and induced effects local park and recreation agencies’ spending has on economic activity, with analysis based on data from the U.S. Census Bureau. This report presents a summary of the key results from the updated study.

How Much Does Parks and Recreation Contribute to the U.S. Economy?

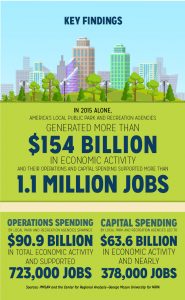
America’s local park and recreation agencies generated $154 billion in economic activity in 2015, nearly $81 billion in value added and more than 1.1 million jobs that boosted labor income by $55 billion.

More specifically, operations spending by local park and recreation agencies generated nearly $91 billion in total economic activity during 2015. That activity boosted real gross domestic product (GDP) by $49 billion and supported more than 732,000 jobs that accounted for nearly $34 billion in salaries, wages and benefits across the nation.

Further, local park and recreation agencies also invested an estimated $23 billion on capital programs in 2015. The capital spending led to an additional $64 billion in economic activity, a contribution of $32 billion to GDP, $21 billion in labor-related income and nearly 378,000 jobs.

These are the key findings from research conducted by NRPA and the Center for Regional Analysis at George Mason University for the Economic Impact of Local Parks Report.

Policymakers and elected officials at all levels of government should take notice. Investments made to local and regional parks not only raise the standard of living in our neighborhoods, towns and cities, but they also spark activity that can ripple throughout the economy.

Categories
Uncategorized

Explore Metro Ridership with our Metro Data Viewer

Categories
Uncategorized

Metrorail Ridership

Average Weekly Metro Ridership (weekdays) - Smithsonian

*Average Monday – Friday daily ridership on the week beginning with the date listed

Categories
Uncategorized

Regional Workforce Efforts