
Public transportation viability and accessibility are vital to the regional economy, especially in the Washington Region where we currently hold the second longest commute time in the nation. The Washington Metropolitan Area Transit Authority is facing several challenges due to funding, administration, and performance issues, especially with its Metrorail system. As the system continues in a period of line closures (safe-tracking), rate hikes, and funding issues, we at CRA are keeping a close eye on Metro related data as a key economic indicator of the region. As a part of this, we have released an interactive Metrorail ridership viewer on our website which breaks down weekday ridership by station. The data currently includes ridership numbers from 2010 through 2017 Quarter 1 and will be updated quarterly into the future.
Click here to Explore the Data
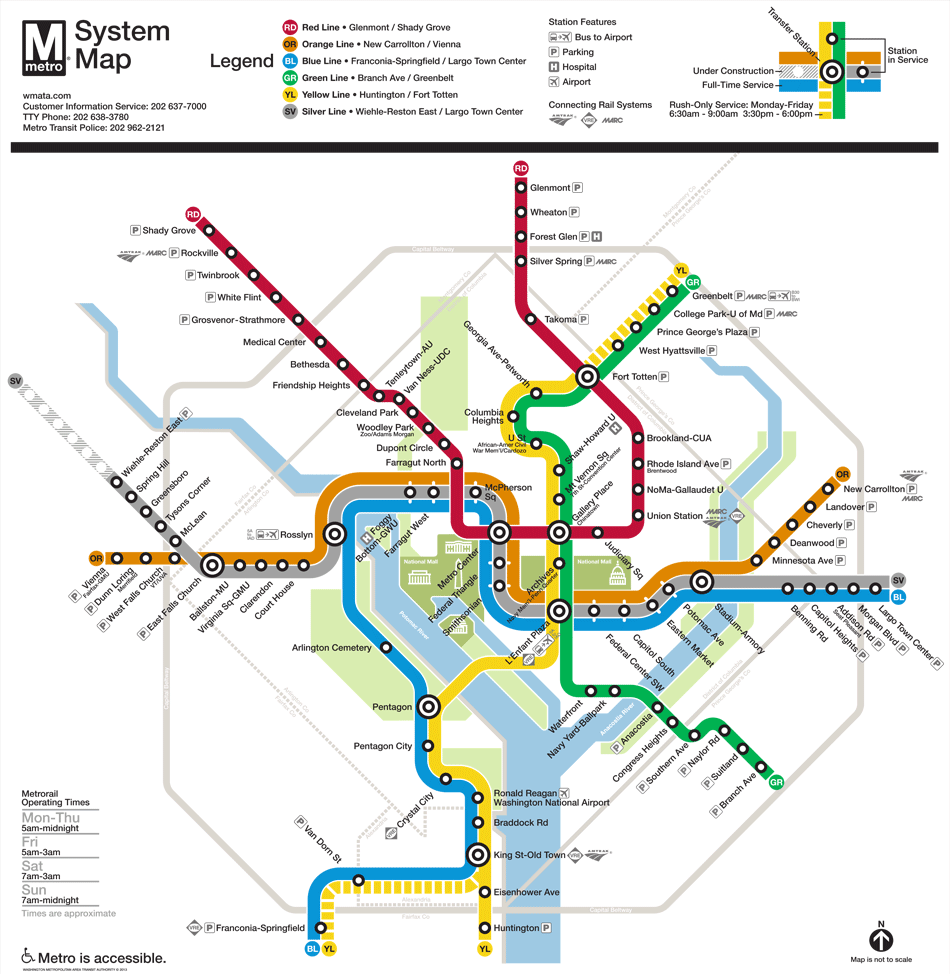
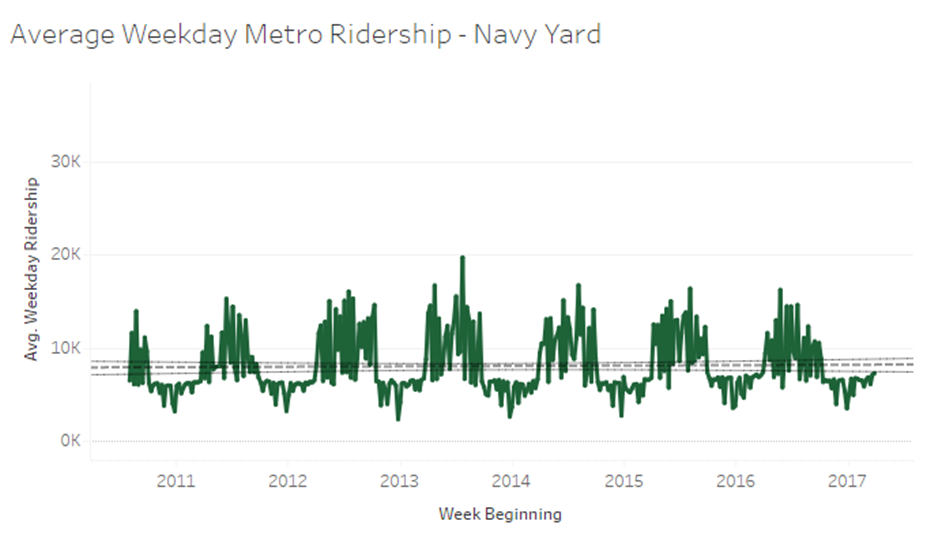
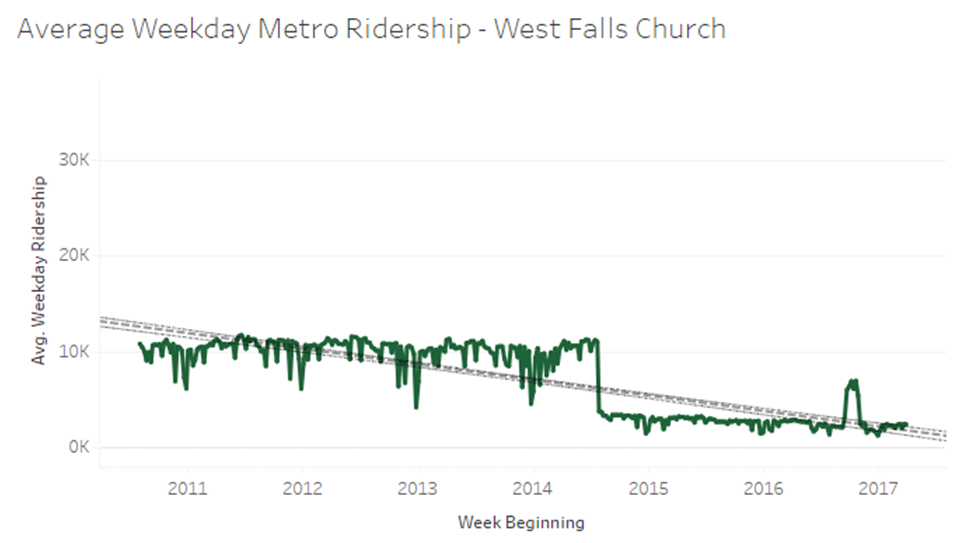
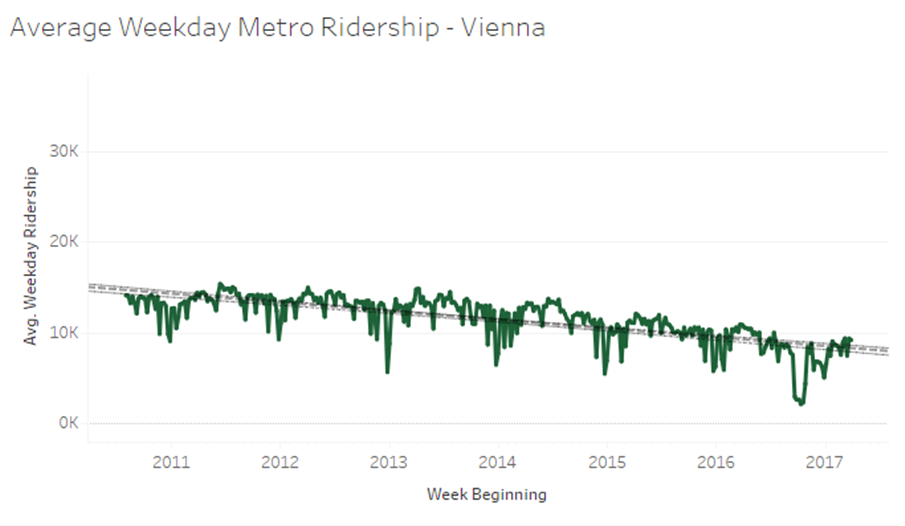
Each data point indicates the average Monday through Friday daily ridership on the week beginning with the date listed. With a decrease across all stations of nearly 16%, 80 out of 92 stations have decreased in weekday ridership from 2011 through 2016. Stations on the ends of the orange line have decreased the most including West Falls Church (-73%), Vienna (-41%), Landover (-38%), Dunn Loring (-34%), Deanwood (-34%), and New Carrolton (-31%). Many park and ride stations have decreased in ridership significantly as well, including Franconia-Springfield (-34%), Huntington (-23%), and Shady Grove (-19%). Among the few stations showing increased ridership, the NoMa-Galluadet Station (New York Ave) ridership increased nearly 15% along with a 6% increase at Navy Yard (6%).
Each station tells a unique story and many real-time phenomena are displayed in the ridership data. A few insights are shown below. Please share any additional unique findings or insights on our twitter page @GMU_CRA or by email to [email protected]
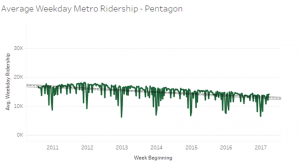
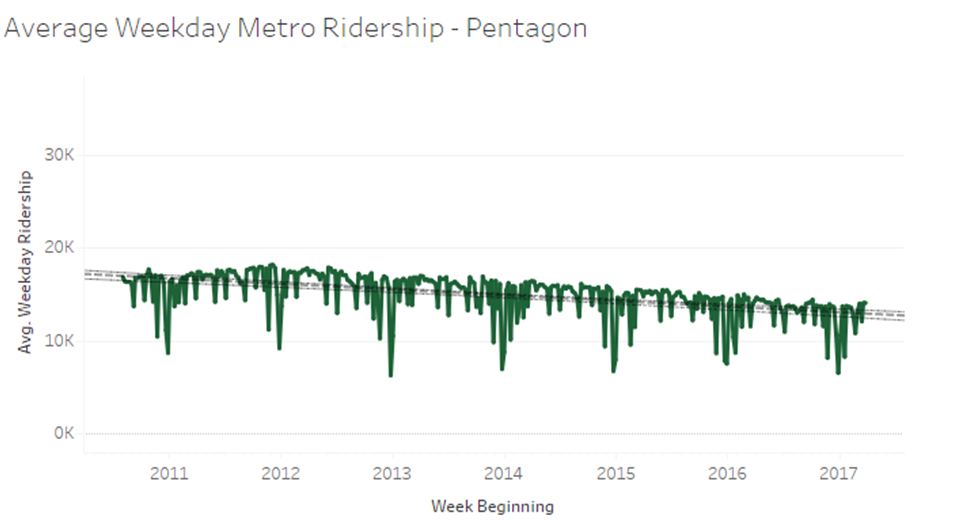
- Many stations cater primarily to workforce commuters. The Pentagon Station – being a big bus to rail transfer point with many federal/nonfederal workers and contractors – displays predictable dips during holidays. Most stations show significant dropoffs during the weeks of Thanksgiving and the Holidays.
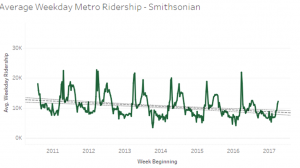
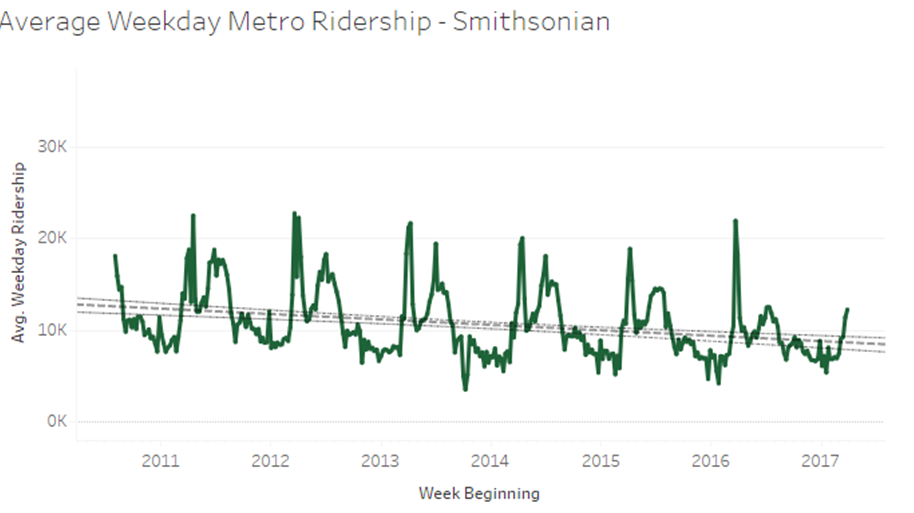
- Cherry Blossom season is one of the most popular times for locals and tourists alike to visit DC. The Smithsonian station, among others, drastically spikes during the week of the Cherry Blossom festival and again in mid-summer.
- The Navy Yard station is located near Nats Park and we can visually see the effects of baseball season on ridership there.

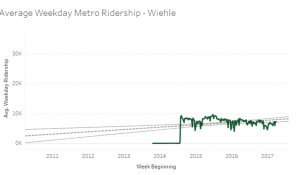
- Service on Phase I of the Silver Line opened on July 26, 2014 between Wiehle – Reston East and Largo Town Center, with five new stations being added to the existing network west of East Falls Church. The effects of this opening are seen by comparing the new station of Whiele to the West falls Church station (just before the silver line meets and joins the Orange). West falls church drops dramtically in late July as Whiele comes on line. The second phase of the silver line out to Ashburn and Dulles is anticipated to open in 2018, and it will be interesting to see its effects.

- SafeTrack is an accelerated track work plan to address safety recommendations and rehabilitate the Metrorail system to improve safety and reliability. The program has been implementing intermittent line segment single tracking and shutdowns since early June 2016 and is expected to end in June 2017. Its effects can be visualised by matching the scheduled surges to specific stations. It will be crucial to analyze the effects of SafeTrack after its completion, specifically whether ridership returns to pre-maintenance levels.
- Single tracking between Vienna and West Falls church causes a dip late 2016 in Vienna ridership (also accounted for in the corresponding spike at West Falls Church above).

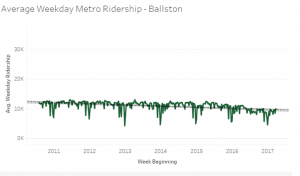
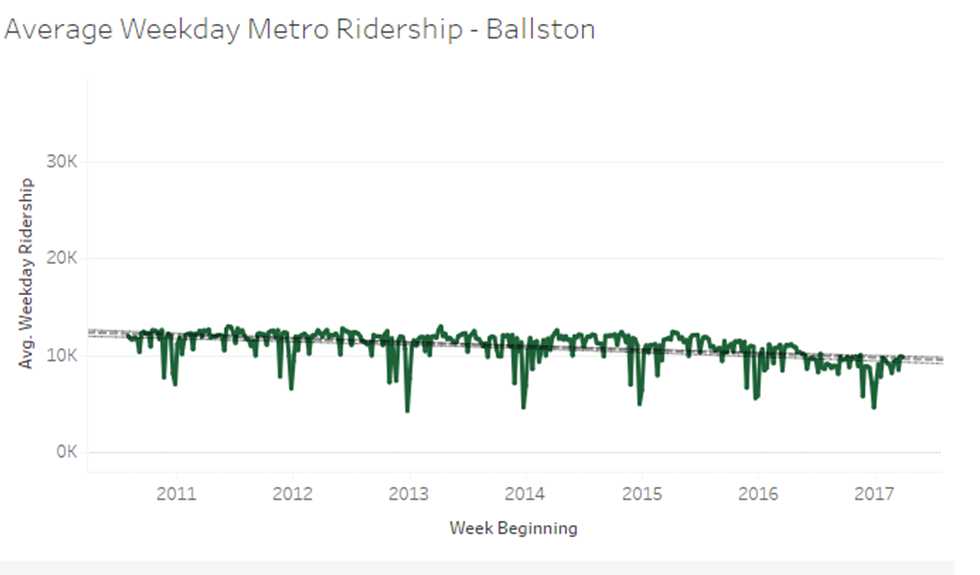
- Ballston ridership sags in mid-2016 due to single tracking.
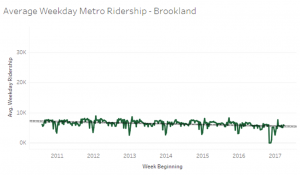
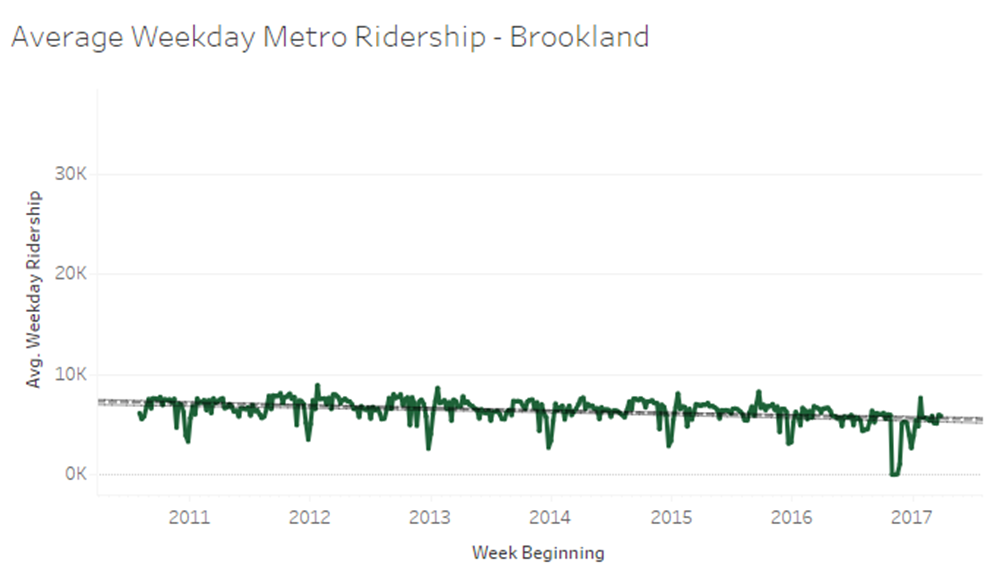
- Brookland ridership goes to zero as a segment of the red line is shut down in November 2016.
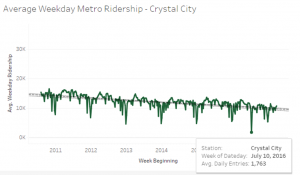
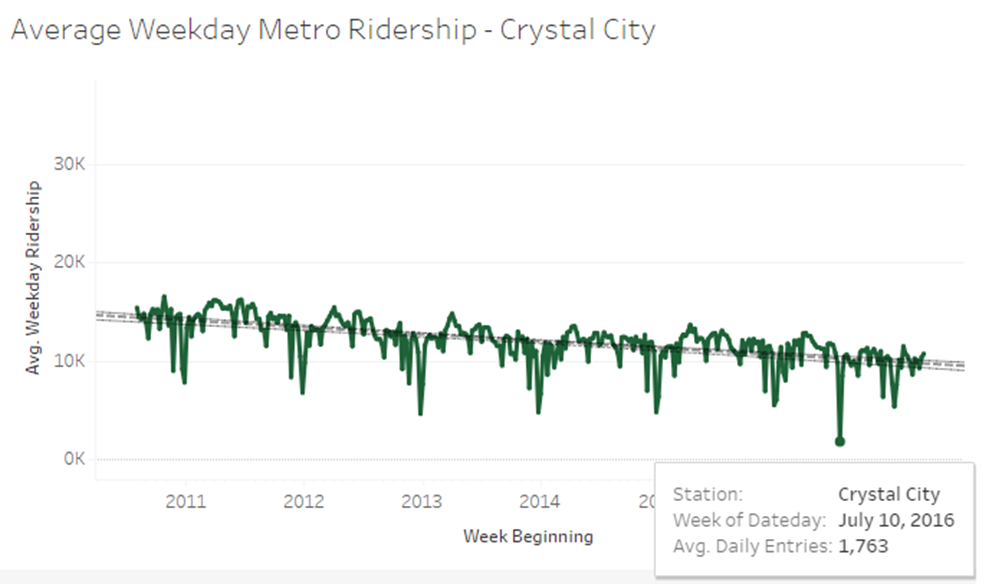
- Crystal City sinks as the blue line closed between Pentagon City and National Airport in mid-July 2016
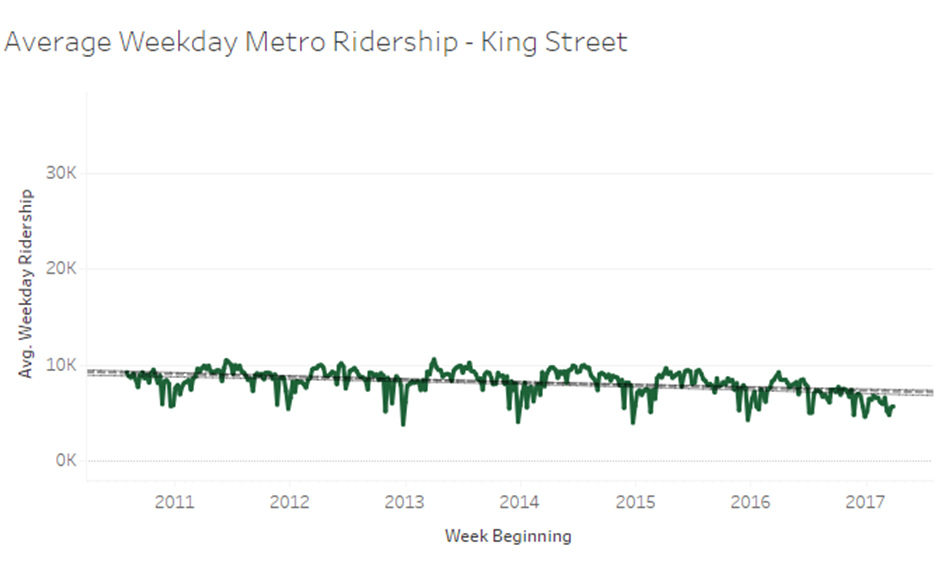
- King Street station is down to Holiday ridership numbers in March 2017 due to single tracking.

- Single tracking between Vienna and West Falls church causes a dip late 2016 in Vienna ridership (also accounted for in the corresponding spike at West Falls Church above).

Please share any unique findings or insights on our twitter page @GMU_CRA or by email to [email protected]