Center for Regional Analysis

Meeting the Housing Needs of Older Adults in Montgomery County

George Mason University’s Center for Regional Analysis partnered with Lisa Sturtevant and Associates and Neighborhood Fundamentals to assess the housing needs of seniors in Montgomery County.

The study of senior housing was performed with The Montgomery County Planning Department, part of The Maryland-National Capital Park and Planning Commission.

View the Study of Housing for Older Adults in Montgomery County.

The study was undertaken by the department’s Research and Special Projects Division in response to the county’s growing number of residents aged 55 and older – estimated to be nearly 288,000 people — and the housing challenges this population faces. Among the goals of the research are to quantify the supply of housing serving older adults in the county; document the characteristics of the senior population; assess current and future demand for senior housing – both the amount and preferred housing types; and recommend ways of preparing to meet growing senior housing needs.

Findings of Housing for Seniors Study

By 2040, one in five residents in Montgomery County will be 65 and older, and one out of three will be 55 and older. The unprecedented growth in the senior population suggests significantly growing housing and service needs for an aging population.

About 15.5 percent of households headed by someone 55 and older spend more than half of their incomes on housing costs each month. This number of severely cost-burdened households suggests unmet housing needs among older adults in Montgomery County. In addition to the need for affordable and accessible housing for very low income and the oldest residents, there is likely current unmet demand for smaller homes to serve the county’s older adult population.

Other findings include:

  • More seniors in Montgomery County will be renters in the years to come due to changing economic characteristics of older adult households.
  • The oldest seniors face the greatest challenges and their numbers are growing, but the vast majority of assisted living facilities in the county are not targeted to older adults with limited incomes.
  • Most older adults would like to age in place while living in their homes independently rather than relying on institutionalized care or family members.
  • Access to neighborhood amenities and services is important to aging in place.
  • Federal funding for senior housing programs is declining.

Recommendations for Housing for Seniors

Proposed strategies are based on an evaluation of current and future housing needs, the county’s current programs, and a review of programs and policies around the country. The strategies are also based on discussions among the Planning Department, Montgomery County Department of Housing and Community Affairs, Commission on Aging and local senior housing developers and operators, among others. The study includes the following recommendations:

  • Support proposed changes in the moderately priced dwelling unit (MPDU) program to support more affordable housing options for seniors.
  • Co-locate senior housing with community facilities and use publicly owned property to produce senior housing.
  • Address senior housing needs in the planning process.
  • Allow more diverse housing types in residential zones and improve the viability of accessory apartments for older adults.
  • Remove zoning and regulatory barriers to group homes and age-restricted housing.
  • Maintain a commitment to senior housing in Montgomery County’s affordable housing fund, the Housing Initiative Fund (HIF).
  • Create set-asides for older adults in the housing choice voucher and rental assistance programs.
  • Improve the effectiveness of homeowner and renter property tax exemptions and credits.
  • Fund emergency assistance to seniors at risk of eviction or homelessness.
  • Expand Montgomery County’s “Design for Life” program to educate developers about marketing opportunities and benefits of accessible housing and to offer additional incentives to include a higher number of accessible units in multi-family developments.
  • Support naturally occurring retirement communities and existing volunteer-led, senior villages.
  • Create a one-stop shop for senior housing programs and services.
  • Explore funding possibilities for senior housing through Maryland’s Medicaid waiver program.

Read the complete Senior Housing Study online.

Inverted Yield Curves and an Impending Recession

Recently the financial press has had several stories talking about interest rate spreads and inverted yield curves with whispers of the word “recession”. But what exactly is an inverted yield curve and what predictive role does it play in the U.S. economy?

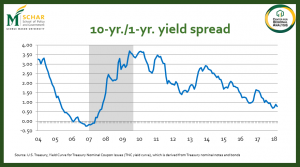
The yield curve is the difference in short-term rates like a three-month or 1-year Treasury note and long-term interest rates like on 10 year Treasury bonds. Short-term interest rates paid on Treasury notes are usually lower than interest paid on long-term bonds. If short-term rates are higher than long-term rates, the yield curve is upside down, or inverted. Over the past several months, the difference in the short term and long term rates have become very small, and there is concern the yield curve will invert (see chart below).

There are many factors that affect government bond rates including stock prices (an alternative investment to bonds), currency exchange rates (international investors), policy actions by the Federal Reserve Bank and other central banks in Europe, China and elsewhere, government deficits/debt levels, and other factors. For this discussion, we will focus on perceptions of risk and uncertainty about future U.S. economic performance. When investors view the outlook for the US economy as uncertain (higher levels of risk), they will expect to earn higher interest rates on government notes and bonds. From this perspective, when short-term rates are higher than long-term rates, investors are saying they are less certain about the economy next year versus ten years from now. That’s extraordinary. Imagine trying to make business decisions in the next 12 months versus 10 years from now and being less certain about next year than far into the future.

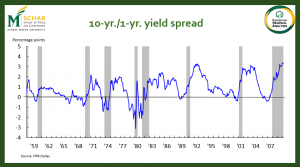
Since 1959 the yield curve has inverted 8 times. For 7 of those times the US economy went into recession within a few months. The figure below shows the spread between 10-year Treasury Bonds and 1-year Treasury Notes. The grey bands indicate recessions in the U.S. economy. Some financial experts see an inverted yield curve as almost a sure sign of an impending recession.

So, are we headed to a recession? After all, even though economic growth since the end of the Great Recession has been relatively slow, the current growth cycle is long-in-the-tooth. In historic terms, we are overdue for a recession. Fortunately, we see the very small yield spread as an artifact of other market factors. Short-term interest rates are increasing in large part because the Federal Reserve Bank is raising its rates to more market-normal levels. On the other end, the economy is doing better and more money is flowing into pension funds, foundations, and other institutional investors. These institutional investors are buying more long-term bonds, which means that interest rates paid on these financial instruments is being held down, which narrows the spread. Still, if we do experience an inverted yield curve over the next several months, expect some market players to “freak out,” at least temporarily.

Many realtor clients in Northern Virginia are highly attuned to market data such as interest rate spreads. If your clients show signs of “freaking out,” we suggest telling them to consult their financial advisors and to consider that the fundamentals of the U.S. economy are still strong. With interest rates still low and a very solid job market, this remains an excellent time to be in the housing market.

DC Region Population Estimates and Components, 2016 – 2017

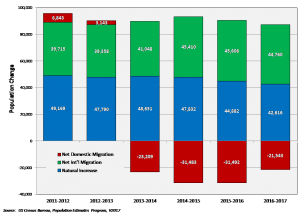
The US Census Bureau released the 2017 Population County and Metro/Micro Area Population Estimates. Between 2016 and 2017, the Washington-Arlington-Alexandria, DC-VA-MD-WV Metropolitan Statistical Area (Hence forth, the Washington Metro Area), increased its population by 65,908 between July 1, 2016 and July 1, 2017.1 This represents an increase of 1.1 percent, and continues the trend of relatively stable regional population growth; the region grew 1.0 percent between 2014 and 2015, and 1.0 percent between 2015 and 2016.

Read the full report here

Figure 1 shows that the region declined in two of the three components of population change. The region had less natural increase and less international migration between 2016 and 2017, than it did between 2015 and 2016. Perhaps most noteworthy for the region is the continued net domestic outmigration for the fourth consecutive year. Although not as large as in previous years, over 21,000 more domestic migrants left the Washington Metro Area than moved to the area.

Event Recap: Symposium on Strengthening the Pipeline from School to Work

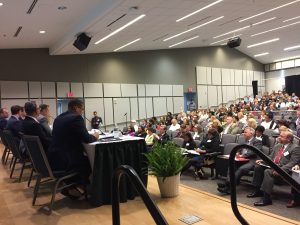
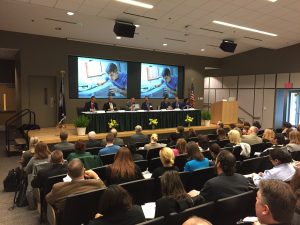
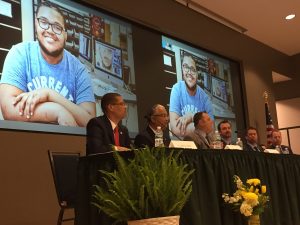
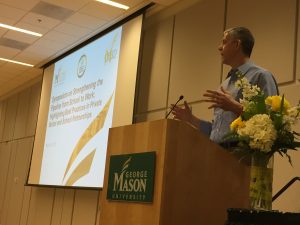
On March 8th, 2018 George Mason University’s Schar School of Policy and Government, the College of Education and Human Development, Mason’s Center for Regional Analysis coordinated the “Symposium on Strengthening the Pipeline from School to Work: Private Sector and School Partnerships”. At the day-long gathering located at the George Mason University Arlington Campus, over 250 educators, business leaders, and academics met to discuss rigorous strategies for establishing and growing partnerships and innovative work-based learning opportunities.

The day consisted of two morning panels which included the following school and business leaders:

  • Anne Holton, former Virginia Secretary of Education and visiting professor of education policy at GMU
  • Jeffery Smith; Superintendent, Hampton City Schools and Champion of the Academies of Hampton
  • Jason Price, Commander, Community Engagement Unit, Hampton Police Division
  • Ralph Saunders, The Academy of Law & Public Safety at Bethel High School
  • Matt Burrows, Superintendent, Appoquimimink (DE) School District
  • Tom Windley, CEO, Premier Physical Therapy
  • Jared Cotton, Superintendent, Henry County (VA) Public Schools
  • Monica Callahan, ChamberRVA, Mission Tomorrow Job Fair, FutureRVA Initiative
  • Charles Britt, NOVA SySTEMic, Northern Virginia Community College
  • Dr. Steve Constantino, Acting Virginia Superintendent of Public Instruction

Former Secretary of Education Arne Duncan gave the keynote address after lunch, affirming the need of business and school collaboration and discussing his current efforts with Chicago CRED. The day ended with an encouraging panel of students who have experienced a work-based learning project. The panel demonstrated the amazing potential of strong partnerships between businesses and schools to 1) help students develop critical skills for success in the workplace and 2) expose students to career options including possibilities they might not have otherwise encountered.

 Acknowledgments

We are greatly appreciative of:

  • Financial support of the Schar School of Policy and Government, the College of Education and Human Development, and within CEHD the Center for Education Policy and Evaluation
  • Staff and logistical support from staff and students at CEHD, and here at the Schar School the Centers for Public Service and the Center for Regional Analysis.

Thank you to our sponsors:

  • Phillips programs for children and families which helps youth with behavioral health needs get the education and training they need to succeed.
  • Skillsource Group, which helps connect both displaced and incumbent workers to the education, training, and placement opportunities they need to succeed.

Special Thanks to the following partners:

26th Annual NOVA Chamber Economic Conference

Dr. Terry Clower spoke about the United States Economic Outlook for 2018 at the 26th Annual Northern Virginia Chamber of Commerce Economic Conference on Thursday, January 18th. The event was held at the Fairview Park Marriott in Falls Church, VA.

View the Presentation here

2016 GDP Growth in the Washington DC Metropolitan Area and Commonwealth of Virginia

The Washington DC Metropolitan Area Continues to Show Lackluster Economic Growth

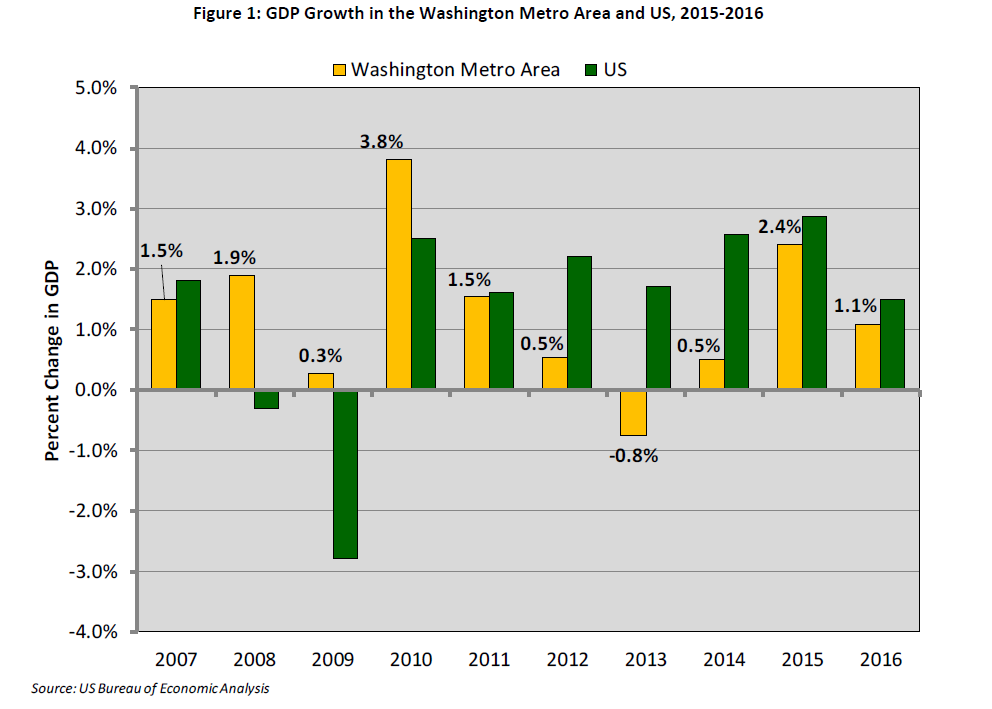
The US Bureau of Economic Analysis released data on 2016 Gross Domestic Product by Metropolitan Area. In 2016, the Washington-Arlington-Alexandria, DC-VA-MD-WV Metropolitan Statistical Area (Hence forth, the Washington Metro Area) had a $449.3 billion economy. This represents an increase of 1.1 percent over the revised 2015 figure of $444.4 billion.[1] Between 2015 and 2016, the Washington Metro Area GDP grew slower than the national rate of 1.5 percent but faster than the Commonwealth of Virginia which grew 0.6 percent.

This is the third consecutive year of regional economic growth. The GDP increase was led by growth in the Professional and Business Services sector – contributing 0.55 percentage points of the 1.1 percent increase in Washington Metro Area GDP. The finance, insurance, real estate, rental, and leasing sector had declining contributions to area GDP – reducing growth in area GDP by 0.15 percentage points.

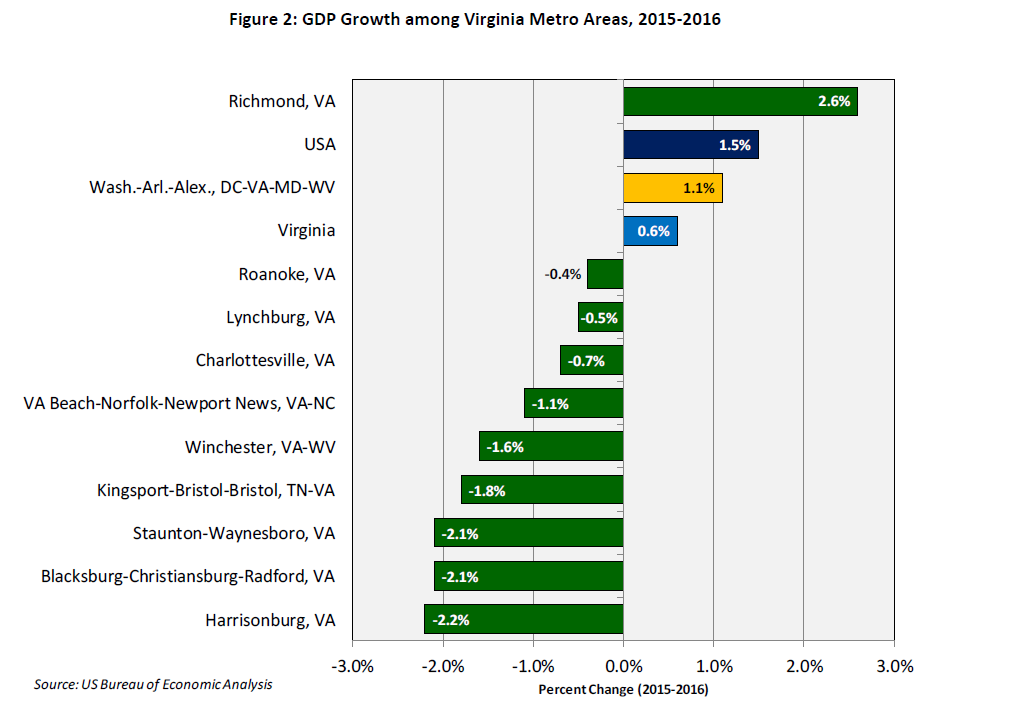
Figure 2 shows that among the ten Metro Areas in Virginia, the Washington Metro Area is one of two that showed growth in GDP between 2015 and 2016. Richmond experienced the largest GDP growth at 2.6 percent, and was the only Virginia metro area to have consistently positive economic growth over the past five years. The metros along the I-81 Corridor, Staunton-Waynesboro, Blacksburg-Christiansburg-Radford, and Harrisonburg, saw the largest declines in GDP at -2.1 percent, -2.1 percent, and -2.2 percent respectively between 2015 and 2016. All three metros had positive economic growth of nearly 3 percent between 2014 and 2015.

[1] The 2015 Washington Metro Area GDP was upwardly revised from 442.4 billion, moving from 1.3 percent growth between 2014-2015 to 2.4 percent growth over the same period in the revised estimate.

GO Virginia Region 7 Plan

The Center for Regional Analysis is proud to support the efforts of the GO Virginia Initiative. CRA has been assisting the Region 7 GO VA Council in the creation of their Growth and Diversification Plan – a  strategic plan which will establish criteria that guide the selection of projects developed by the regions will effectively move the economy forward. The completed document is available here.

Region 7 includes the counties of Arlington, Fairfax, Loudoun, and Prince William and the cities of Alexandria, Fairfax, Falls Church, Manassas, and Manassas Park in Northern Virginia.

Other GO Virginia Support

In addition, CRA partnered with Old Dominion University and the Natelson Dale Group in the creation of the Growth and Diversification Plan for Region 5 (Hampton Roads). That report is available here.

In early Summer 2017, CRA was contracted by the Virginia Department of Housing and Community Development (DHCD) to compile baseline data for each of the seven GO Virginia Regions. The resulting data is available here in presentation and excel formats.

About GO Virginia

The Virginia Initiative for Growth and Opportunity in Each Region (GO Virginia) was initiated by Virginia’s senior business leaders to foster private-sector growth and job creation through state incentives for regional collaboration by business, education, and government. Recognizing the harsh effect of deep federal budget cuts on a Virginia economy that is overly dependent on public-sector jobs, they launched the GO Virginia campaign to work for regional cooperation on private-sector growth, job creation, and career readiness. For more information visit: http://www.govirginia.org/ or http://www.dhcd.virginia.gov/index.php/go-virginia.html