Categories
CRA Research

Foreign Born, Non-Citizen Workers in the Washington Region

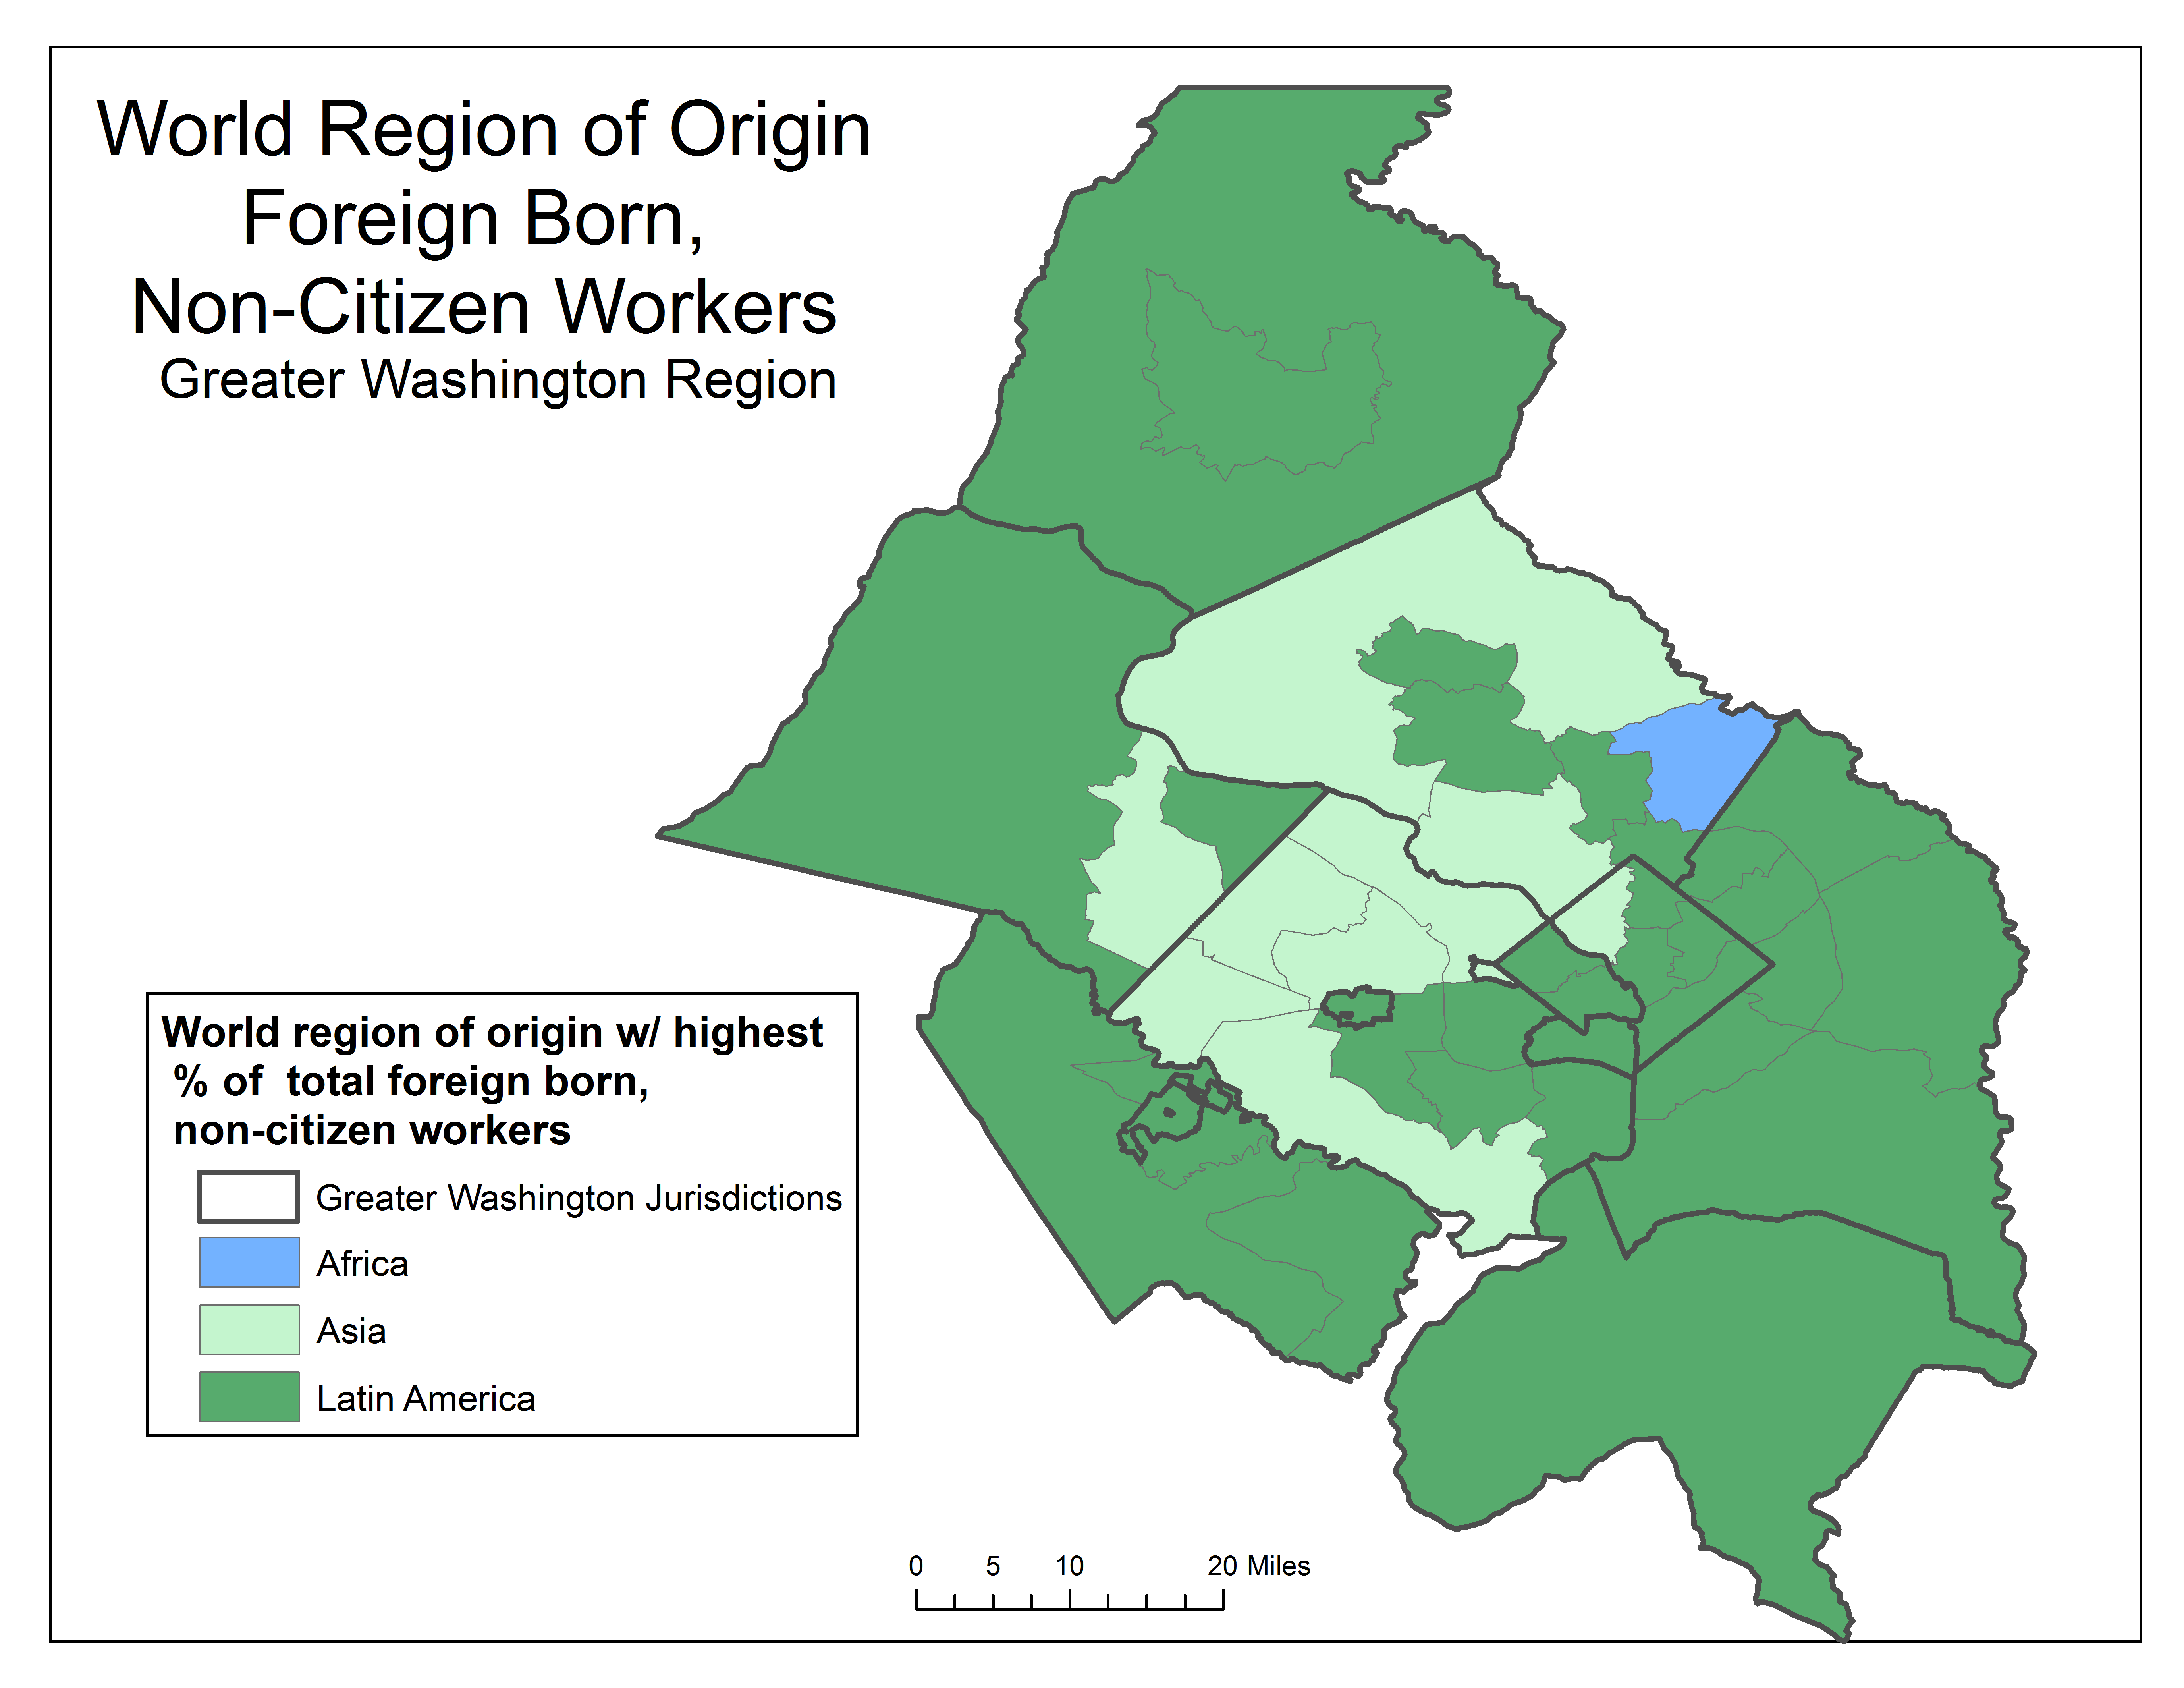
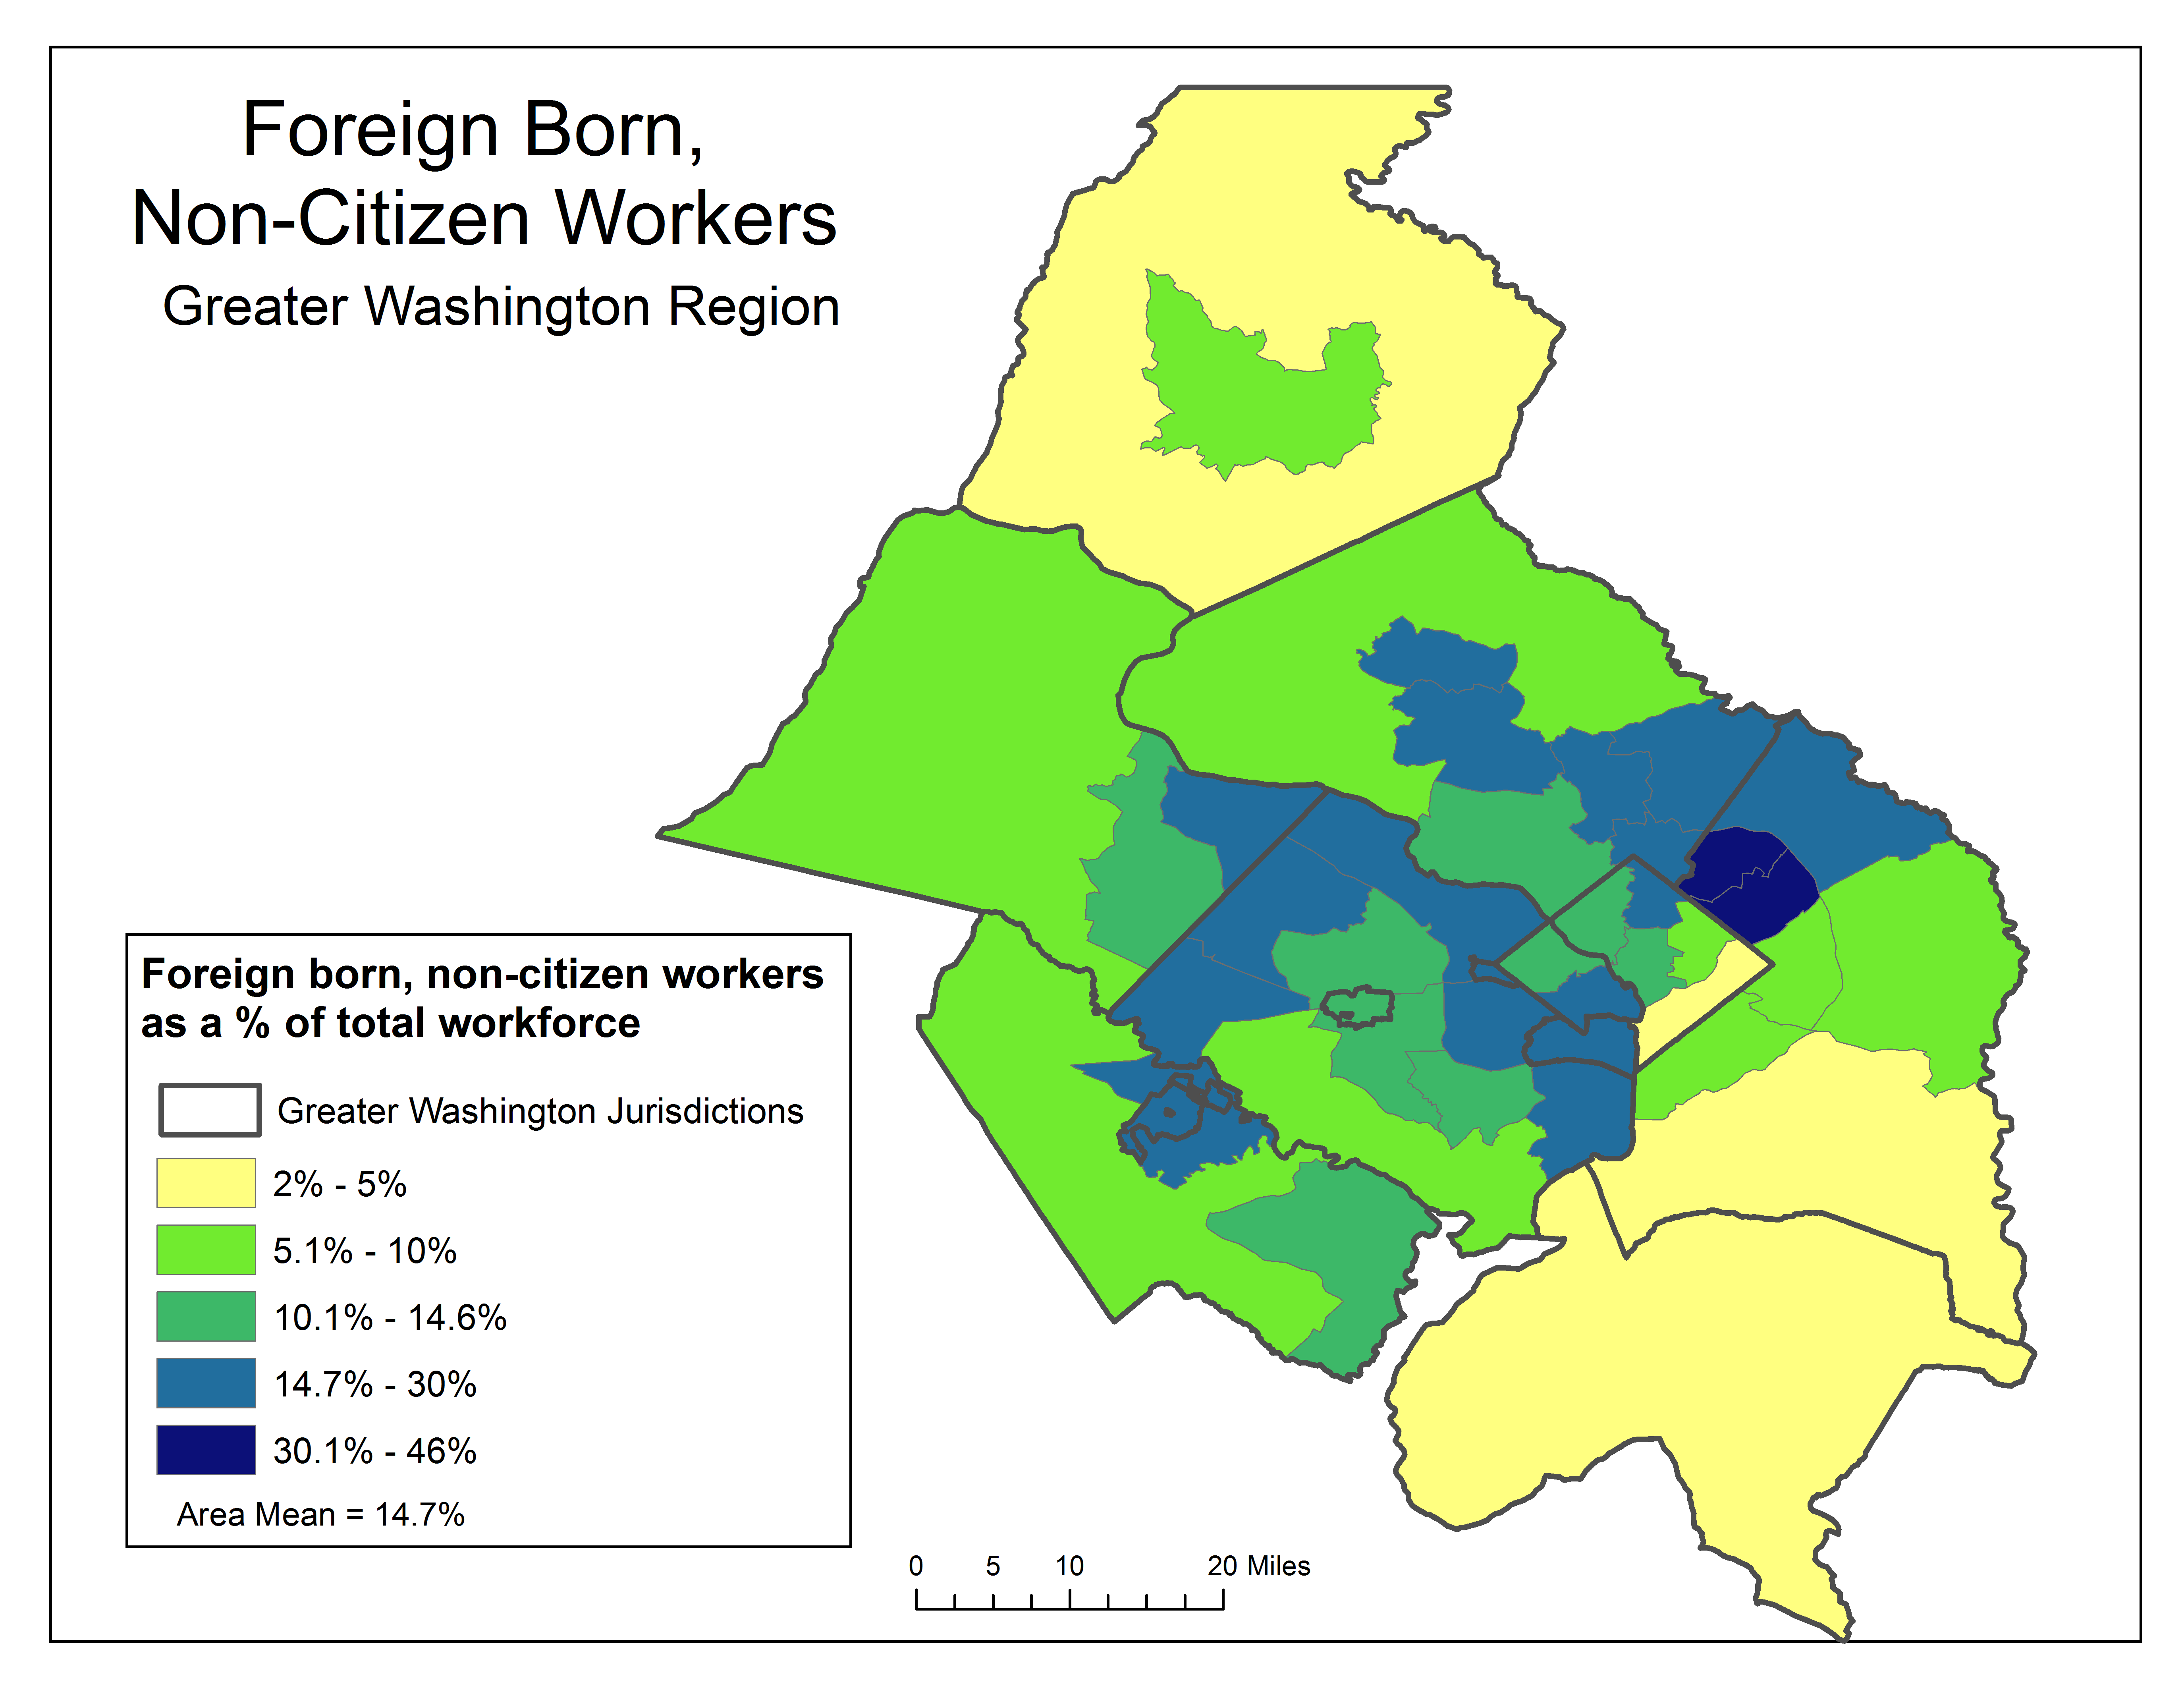
As a part of the new working paper series, the Center for Regional Analysis has put together an analysis and characterization of foreign-born, non-citizen workers in the Greater Washington region.

  • Foreign-born, non-citizen workers account for 462 ,000—or almost 15 percent—of the approximately 3.1 million workers in the Greater Washington regional workforce.
  • Less than 20 percent of Foreign-born, non-citizen workers arrived since 2010.
  • Almost 1 in 4 of the Greater Washington region’s foreign-born, non-citizen workers come from El Salvador, making it the region’s most common country of origin.
  • Employers in the construction and hospitality industries rely heavily on foreign-born, non-citizen workers.
    • Approximately half of the workers filling construction, and cleaning and maintenance occupations are foreign-born, non-citizens.
    • Roughly one-third of the region’s food service workers are foreign-born, non-citizens.
Read the full report here
Categories
Slider

Promoting Parks and Recreation’s Role in Economic Development

The National Recreation and Park Association and George Mason University’s Center for Regional Analysis explored the role that quality park amenities play in 21st century regional economic development. Based on conversations with more than 70 park and recreation professionals, economic development practitioners and site-location consultants, this report highlights the important supporting role parks and recreation in recruiting and retaining businesses and skilled workers.

Read the Full Report Here

Parks and recreation support environmental stewardship and promotes health and wellness in communities across the United States. Less appreciated are these agencies’ many contributions to economic prosperity. Park and recreation agencies employ hundreds of thousands of people while their operations and capital spending generate significant economic activity. Moreover, local parks shape perceptions of and enhance the quality of life in communities.

This study builds on previous NRPA research on the economic importance of local park and recreation agencies by exploring the role that quality park amenities play in 21st century regional economic development. It reviews the impact that a community’s quality of life has on its ability to attract and retain business and a talented workforce. This report also identifies opportunities where local parks officials can better engage with their communities’ economic development entities.

Key Findings

  • Park and recreation departments are significant employers, and their operations and capital spending generate significant economic impacts on local communities.
  • Investments in improving a community’s quality of life create a virtuous cycle: high quality-of-life locations attract workers, which attract employers, which in turn attract even more investments and jobs.
  • High-quality parks and recreation can play a pivotal role in attracting and retaining quality businesses.
  • Active engagement with companies and workers influence business expansion decisions and attract new residents to a community.
  • Key partners to drive greater parks and recreation involvement in economic development planning and activities include:
    • Municipal departments that shape quality of life (e.g., public schools, public libraries, transit agencies)
    • Shapers of the built environment (e.g., private sector developers, downtown development organizations, business improvement districts, metropolitan planning organizations)
    • Neighboring park and recreation agencies and private non-profit competitors (e.g., YMCAs, Boys and Girls Clubs)

You can read the full report and dig deeper into the insights through 14 mini-case studies highlighting how park and recreation agencies serve in a vital role to attract and retain businesses and skilled workers.

Categories
Economic Indicators Latest Updates Uncategorized

Inverted Yield Curves and an Impending Recession

Recently the financial press has had several stories talking about interest rate spreads and inverted yield curves with whispers of the word “recession”. But what exactly is an inverted yield curve and what predictive role does it play in the U.S. economy?

The yield curve is the difference in short-term rates like a three-month or 1-year Treasury note and long-term interest rates like on 10 year Treasury bonds. Short-term interest rates paid on Treasury notes are usually lower than interest paid on long-term bonds. If short-term rates are higher than long-term rates, the yield curve is upside down, or inverted. Over the past several months, the difference in the short term and long term rates have become very small, and there is concern the yield curve will invert (see chart below).

There are many factors that affect government bond rates including stock prices (an alternative investment to bonds), currency exchange rates (international investors), policy actions by the Federal Reserve Bank and other central banks in Europe, China and elsewhere, government deficits/debt levels, and other factors. For this discussion, we will focus on perceptions of risk and uncertainty about future U.S. economic performance. When investors view the outlook for the US economy as uncertain (higher levels of risk), they will expect to earn higher interest rates on government notes and bonds. From this perspective, when short-term rates are higher than long-term rates, investors are saying they are less certain about the economy next year versus ten years from now. That’s extraordinary. Imagine trying to make business decisions in the next 12 months versus 10 years from now and being less certain about next year than far into the future.

Since 1959 the yield curve has inverted 8 times. For 7 of those times the US economy went into recession within a few months. The figure below shows the spread between 10-year Treasury Bonds and 1-year Treasury Notes. The grey bands indicate recessions in the U.S. economy. Some financial experts see an inverted yield curve as almost a sure sign of an impending recession.

So, are we headed to a recession? After all, even though economic growth since the end of the Great Recession has been relatively slow, the current growth cycle is long-in-the-tooth. In historic terms, we are overdue for a recession. Fortunately, we see the very small yield spread as an artifact of other market factors. Short-term interest rates are increasing in large part because the Federal Reserve Bank is raising its rates to more market-normal levels. On the other end, the economy is doing better and more money is flowing into pension funds, foundations, and other institutional investors. These institutional investors are buying more long-term bonds, which means that interest rates paid on these financial instruments is being held down, which narrows the spread. Still, if we do experience an inverted yield curve over the next several months, expect some market players to “freak out,” at least temporarily.

Many realtor clients in Northern Virginia are highly attuned to market data such as interest rate spreads. If your clients show signs of “freaking out,” we suggest telling them to consult their financial advisors and to consider that the fundamentals of the U.S. economy are still strong. With interest rates still low and a very solid job market, this remains an excellent time to be in the housing market.

Categories
CRA Research Economic Indicators Latest Updates News

DC Region Population Estimates and Components, 2016 – 2017

The US Census Bureau released the 2017 Population County and Metro/Micro Area Population Estimates. Between 2016 and 2017, the Washington-Arlington-Alexandria, DC-VA-MD-WV Metropolitan Statistical Area (Hence forth, the Washington Metro Area), increased its population by 65,908 between July 1, 2016 and July 1, 2017.1 This represents an increase of 1.1 percent, and continues the trend of relatively stable regional population growth; the region grew 1.0 percent between 2014 and 2015, and 1.0 percent between 2015 and 2016.

Read the full report here

Figure 1 shows that the region declined in two of the three components of population change. The region had less natural increase and less international migration between 2016 and 2017, than it did between 2015 and 2016. Perhaps most noteworthy for the region is the continued net domestic outmigration for the fourth consecutive year. Although not as large as in previous years, over 21,000 more domestic migrants left the Washington Metro Area than moved to the area.

Categories
Latest Updates Other Events Slider

Event Recap: Symposium on Strengthening the Pipeline from School to Work

On March 8th, 2018 George Mason University’s Schar School of Policy and Government, the College of Education and Human Development, Mason’s Center for Regional Analysis coordinated the “Symposium on Strengthening the Pipeline from School to Work: Private Sector and School Partnerships”. At the day-long gathering located at the George Mason University Arlington Campus, over 250 educators, business leaders, and academics met to discuss rigorous strategies for establishing and growing partnerships and innovative work-based learning opportunities.

The day consisted of two morning panels which included the following school and business leaders:

  • Anne Holton, former Virginia Secretary of Education and visiting professor of education policy at GMU
  • Jeffery Smith; Superintendent, Hampton City Schools and Champion of the Academies of Hampton
  • Jason Price, Commander, Community Engagement Unit, Hampton Police Division
  • Ralph Saunders, The Academy of Law & Public Safety at Bethel High School
  • Matt Burrows, Superintendent, Appoquimimink (DE) School District
  • Tom Windley, CEO, Premier Physical Therapy
  • Jared Cotton, Superintendent, Henry County (VA) Public Schools
  • Monica Callahan, ChamberRVA, Mission Tomorrow Job Fair, FutureRVA Initiative
  • Charles Britt, NOVA SySTEMic, Northern Virginia Community College
  • Dr. Steve Constantino, Acting Virginia Superintendent of Public Instruction

Former Secretary of Education Arne Duncan gave the keynote address after lunch, affirming the need of business and school collaboration and discussing his current efforts with Chicago CRED. The day ended with an encouraging panel of students who have experienced a work-based learning project. The panel demonstrated the amazing potential of strong partnerships between businesses and schools to 1) help students develop critical skills for success in the workplace and 2) expose students to career options including possibilities they might not have otherwise encountered.

 Acknowledgments

We are greatly appreciative of:

  • Financial support of the Schar School of Policy and Government, the College of Education and Human Development, and within CEHD the Center for Education Policy and Evaluation
  • Staff and logistical support from staff and students at CEHD, and here at the Schar School the Centers for Public Service and the Center for Regional Analysis.

Thank you to our sponsors:

  • Phillips programs for children and families which helps youth with behavioral health needs get the education and training they need to succeed.
  • Skillsource Group, which helps connect both displaced and incumbent workers to the education, training, and placement opportunities they need to succeed.

Special Thanks to the following partners:

Categories
Economic Indicators Latest Updates Presentations

26th Annual NOVA Chamber Economic Conference

Dr. Terry Clower spoke about the United States Economic Outlook for 2018 at the 26th Annual Northern Virginia Chamber of Commerce Economic Conference on Thursday, January 18th. The event was held at the Fairview Park Marriott in Falls Church, VA.

View the Presentation here

Categories
Economic Indicators Latest Updates News

2016 GDP Growth in the Washington DC Metropolitan Area and Commonwealth of Virginia

The Washington DC Metropolitan Area Continues to Show Lackluster Economic Growth

The US Bureau of Economic Analysis released data on 2016 Gross Domestic Product by Metropolitan Area. In 2016, the Washington-Arlington-Alexandria, DC-VA-MD-WV Metropolitan Statistical Area (Hence forth, the Washington Metro Area) had a $449.3 billion economy. This represents an increase of 1.1 percent over the revised 2015 figure of $444.4 billion.[1] Between 2015 and 2016, the Washington Metro Area GDP grew slower than the national rate of 1.5 percent but faster than the Commonwealth of Virginia which grew 0.6 percent.

This is the third consecutive year of regional economic growth. The GDP increase was led by growth in the Professional and Business Services sector – contributing 0.55 percentage points of the 1.1 percent increase in Washington Metro Area GDP. The finance, insurance, real estate, rental, and leasing sector had declining contributions to area GDP – reducing growth in area GDP by 0.15 percentage points.

Figure 2 shows that among the ten Metro Areas in Virginia, the Washington Metro Area is one of two that showed growth in GDP between 2015 and 2016. Richmond experienced the largest GDP growth at 2.6 percent, and was the only Virginia metro area to have consistently positive economic growth over the past five years. The metros along the I-81 Corridor, Staunton-Waynesboro, Blacksburg-Christiansburg-Radford, and Harrisonburg, saw the largest declines in GDP at -2.1 percent, -2.1 percent, and -2.2 percent respectively between 2015 and 2016. All three metros had positive economic growth of nearly 3 percent between 2014 and 2015.

[1] The 2015 Washington Metro Area GDP was upwardly revised from 442.4 billion, moving from 1.3 percent growth between 2014-2015 to 2.4 percent growth over the same period in the revised estimate.