
Listen to Dr. Clower discuss the Washington Region with What’s Working in Washington
Category: News

Good Day!
We are excited to announce the date for this year’s Economic Forum to be presented jointly by the Stephen S. Fuller Institute and Center for Regional Analysis at Mason.
Read the Conference Issue of Washington Economy Watch: Here
Come hear GMU colleagues Stephen Fuller and Terry Clower as they examine the DC region’s current challenges, opportunities, and economic outlook for 2023.

When:
Tuesday, November 15, 2022
8:30 am – 11:00 am (ET)
Where:
GMU Arlington Campus
Van Metre Hall, 1st Floor Auditorium
3351 Fairfax Dr., Arlington, VA 22201
Metro: Clarendon, Virginia Square
Parking Garage Access: Off N. Kirkland Street
Registration
Attendance is free but please register at CRA_Event
| Agenda | |||
| 8:30 – 9:00 | Coffee and Fellowship | ||
| 9:00 – 9:03 | Welcome to Campus | Dean Mark Rozell | |
| 9:03 – 9:10 | President’s Welcome | Dr. Greg Washington | |
| 9:10 – 9:20 | Opening remarks | Bob Buchanan | |
| 9:20 – 10:00 | Is the Washington Region’s Economy Still Recession Proof? | Dr. Stephen S. Fuller | |
| 10:00 – 10:40 | Challenges, Opportunities, & Adaptation: The National Capital Region in 2023 and Beyond | Dr. Terry L. Clower | |
| 10:40 – 11:00 | Q&A, Engagement | Dr. Clower & Dr. Fuller | |
| 11:00 | Adjourn |
Questions? Email us at [email protected]
We look forward to seeing you all in person on November 15, 2022!
The US Census Bureau released the 2017 Population County and Metro/Micro Area Population Estimates. Between 2016 and 2017, the Washington-Arlington-Alexandria, DC-VA-MD-WV Metropolitan Statistical Area (Hence forth, the Washington Metro Area), increased its population by 65,908 between July 1, 2016 and July 1, 2017.1 This represents an increase of 1.1 percent, and continues the trend of relatively stable regional population growth; the region grew 1.0 percent between 2014 and 2015, and 1.0 percent between 2015 and 2016.
Read the full report here
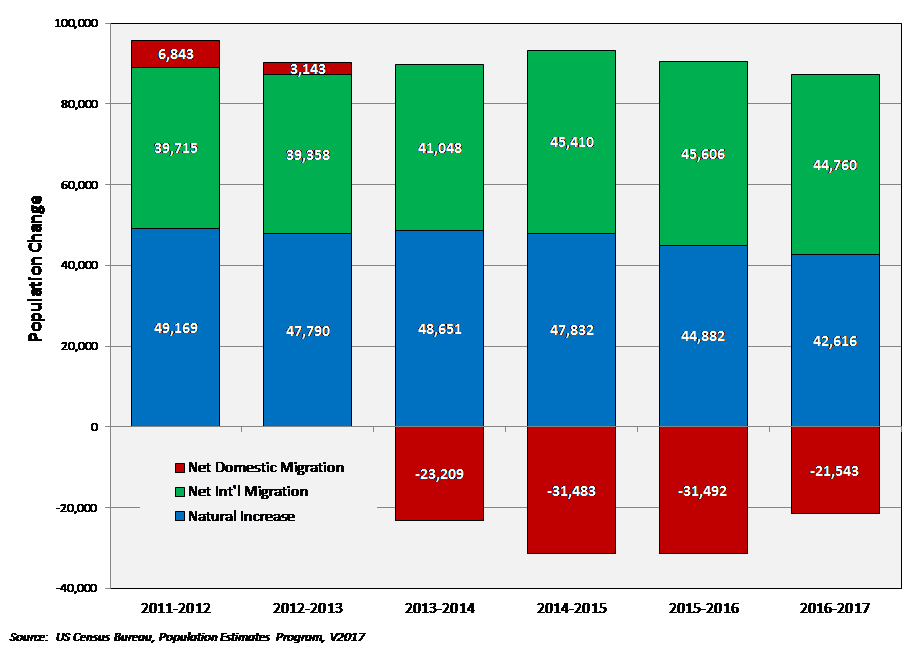
Figure 1 shows that the region declined in two of the three components of population change. The region had less natural increase and less international migration between 2016 and 2017, than it did between 2015 and 2016. Perhaps most noteworthy for the region is the continued net domestic outmigration for the fourth consecutive year. Although not as large as in previous years, over 21,000 more domestic migrants left the Washington Metro Area than moved to the area.
The Washington DC Metropolitan Area Continues to Show Lackluster Economic Growth
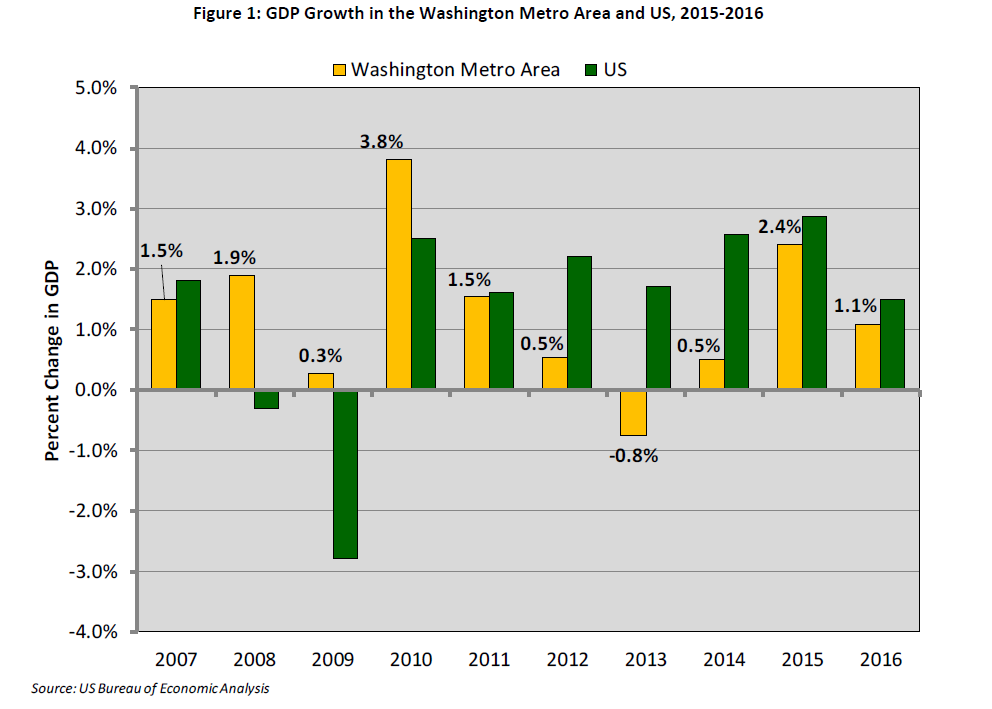
The US Bureau of Economic Analysis released data on 2016 Gross Domestic Product by Metropolitan Area. In 2016, the Washington-Arlington-Alexandria, DC-VA-MD-WV Metropolitan Statistical Area (Hence forth, the Washington Metro Area) had a $449.3 billion economy. This represents an increase of 1.1 percent over the revised 2015 figure of $444.4 billion.[1] Between 2015 and 2016, the Washington Metro Area GDP grew slower than the national rate of 1.5 percent but faster than the Commonwealth of Virginia which grew 0.6 percent.
This is the third consecutive year of regional economic growth. The GDP increase was led by growth in the Professional and Business Services sector – contributing 0.55 percentage points of the 1.1 percent increase in Washington Metro Area GDP. The finance, insurance, real estate, rental, and leasing sector had declining contributions to area GDP – reducing growth in area GDP by 0.15 percentage points.
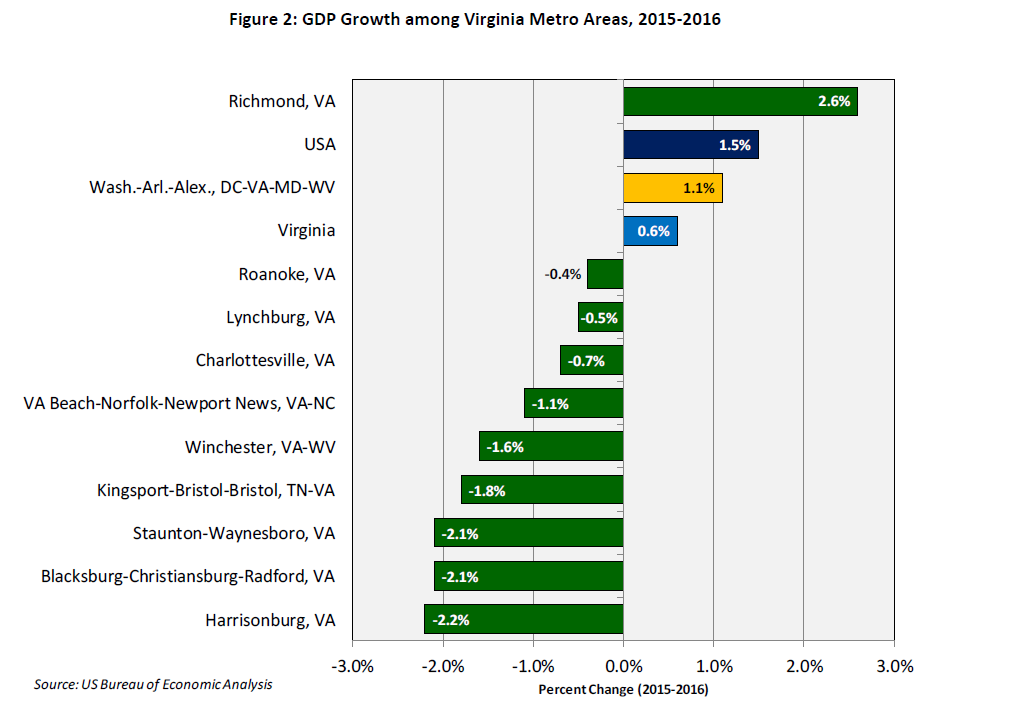
Figure 2 shows that among the ten Metro Areas in Virginia, the Washington Metro Area is one of two that showed growth in GDP between 2015 and 2016. Richmond experienced the largest GDP growth at 2.6 percent, and was the only Virginia metro area to have consistently positive economic growth over the past five years. The metros along the I-81 Corridor, Staunton-Waynesboro, Blacksburg-Christiansburg-Radford, and Harrisonburg, saw the largest declines in GDP at -2.1 percent, -2.1 percent, and -2.2 percent respectively between 2015 and 2016. All three metros had positive economic growth of nearly 3 percent between 2014 and 2015.
[1] The 2015 Washington Metro Area GDP was upwardly revised from 442.4 billion, moving from 1.3 percent growth between 2014-2015 to 2.4 percent growth over the same period in the revised estimate.

The Center for Regional Analysis is proud to support the efforts of the GO Virginia Initiative. CRA has been assisting the Region 7 GO VA Council in the creation of their Growth and Diversification Plan – a strategic plan which will establish criteria that guide the selection of projects developed by the regions will effectively move the economy forward. The completed document is available here.
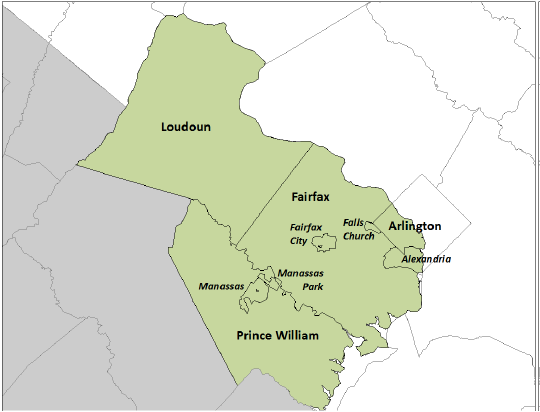
Region 7 includes the counties of Arlington, Fairfax, Loudoun, and Prince William and the cities of Alexandria, Fairfax, Falls Church, Manassas, and Manassas Park in Northern Virginia.
Other GO Virginia Support
In addition, CRA partnered with Old Dominion University and the Natelson Dale Group in the creation of the Growth and Diversification Plan for Region 5 (Hampton Roads). That report is available here.
In early Summer 2017, CRA was contracted by the Virginia Department of Housing and Community Development (DHCD) to compile baseline data for each of the seven GO Virginia Regions. The resulting data is available here in presentation and excel formats.
About GO Virginia
The Virginia Initiative for Growth and Opportunity in Each Region (GO Virginia) was initiated by Virginia’s senior business leaders to foster private-sector growth and job creation through state incentives for regional collaboration by business, education, and government. Recognizing the harsh effect of deep federal budget cuts on a Virginia economy that is overly dependent on public-sector jobs, they launched the GO Virginia campaign to work for regional cooperation on private-sector growth, job creation, and career readiness. For more information visit: http://www.govirginia.org/ or http://www.dhcd.virginia.gov/index.php/go-virginia.html
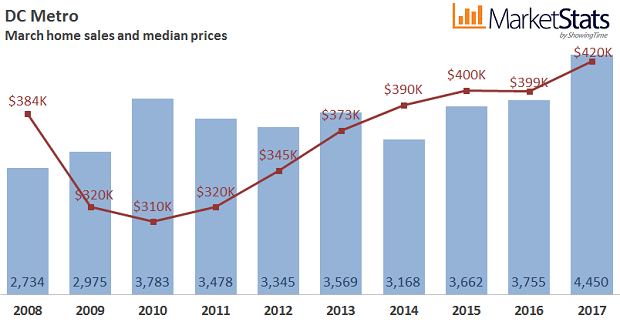
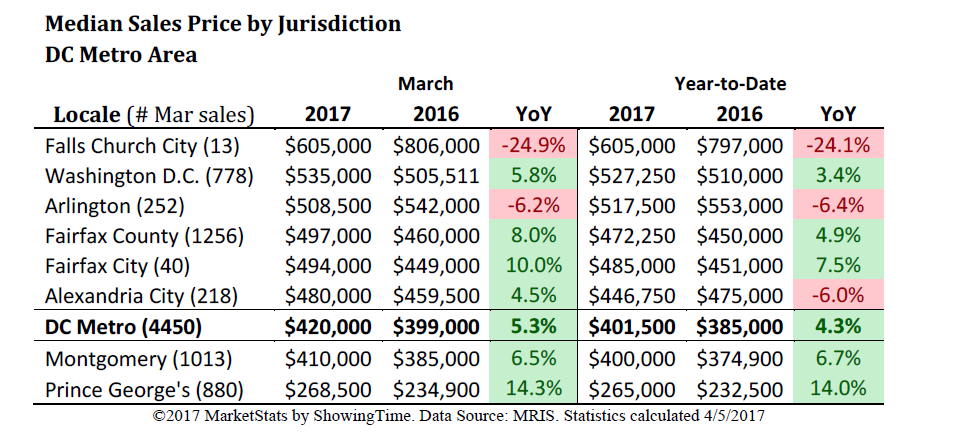
The housing market in the Washington metro area continues to tighten as median sales price is highest March level of the decade, sales and pending sales are at decade highs, and inventory levels decline for the eleventh month in a row
- March 2017’s median sales price of $420,00 was up 5.3% or $21,000 compared to last year. This is the highest March median sales price of the last decade, easily topping the prior high of $400,000 seen in 2015.
- Sales volume across the DC Metro area was nearly $2.3 billion, up 26.7% from last March.
- Closed sales of 4,450 were up 18.5% compared to last year. It was also the highest March level in a decade and easily exceeding the 3,755 sales recorded last March.
- New contract activity of 6,254 also reached a ten-year March high, increasing by 1.4% over last year. New listings of 8,210 were down 1.7% compared to last year.
- Active listings of 8,648 are down 11.5% compared to last year but up 15.3% compared to last month. This is the eleventh consecutive month of declines in year-over-year inventory levels, and inventories are at the lowest March level since 2014.
- The average percent of original list price received at sale in March was 97.9%, up from last year’s 97.1%, and also up from last month’s 97.4%.
- The median days-on-market for March 2017 was 15 days, 12 days lower than last year.
This analysis of the Washington, D.C. Metro Area housing market was prepared by Elliot Eisenberg, Ph.D. of MarketStats by ShowingTime and is based on March 2017 MRIS housing data.